Full Report
The numbers behind Zoetis Inc.: as-reported financial statements and company metrics for FY2021–FY2025, traced to the source filings, opened with the share-price history those statements have to justify. Every linked figure opens the exact page of the filing it was printed on, with the statement row highlighted. Amounts in US$ millions unless noted.
Reading notes: Every FY2021–FY2025 figure in the four core statements and the segment table is taken from that year's own Zoetis Form 10-K (each 10-K prints three years of income/cash-flow and two years of balance sheet); each cell links to the exact statement page. Revenue breakdown uses Zoetis' reported 'Revenue by species' disaggregation (Note 4). Companion Animal and Livestock are the printed species subtotals; a Contract manufacturing human health line and a Total Revenue row complete the split. The Operating Segments statement shows Zoetis' two reportable segments (U.S. and International) with segment revenue, segment earnings and gross margin, reconciled by 'Total operating segments' earnings (Note 19, Selected Statement of Income Information). FY2016–FY2020 figures in the Long-Term Record are from the standardized SEC XBRL data feed and are shown without page links (those filings are not in the corpus).
Share Price — Full Available History — 13 Years
The stock closed at $76.00 on Jul 18, 2026 — up 145% over the window shown (+6.9% a year), trading between $28.40 and $247.03. At that close the stock trades at 13× FY2025 diluted EPS as reported below.
Source: market price feed, monthly closes, sampled from 3,383 source observations, Feb 2013–Jul 2026. Price return only, excludes dividends.
FY2025 at a Glance
Revenue (US$ millions)
Net income (US$ millions)
Diluted EPS
Source: FY2025 consolidated statements [1] [2] [3] [4]. Click any linked figure to open the filing page with the row highlighted.
Revenue by Species
| Revenue by Species | FY2021 | FY2022 | FY2023 | FY2024 | FY2025 |
|---|---|---|---|---|---|
| Companion Animal | 4,689 | 5,203 | 5,576 | 6,278 | 6,587 |
| Livestock | 3,005 | 2,791 | 2,890 | 2,898 | 2,764 |
| Contract manufacturing human health | 82 | 86 | 78 | 80 | 116 |
| Total Revenue | 7,776 | 8,080 | 8,544 | 9,256 | 9,467 |
| Total Revenue growth, derived | — | +3.9% | +5.7% | +8.3% | +2.3% |
Source: Form 10-K Note 4 — Revenue (Revenue by species) [5] [6] [7] [8]. Click any linked figure to open the filing page with the row highlighted.
Operating Segments — Revenue Earnings
| Operating Segments — Revenue Earnings | FY2021 | FY2022 | FY2023 | FY2024 | FY2025 |
|---|---|---|---|---|---|
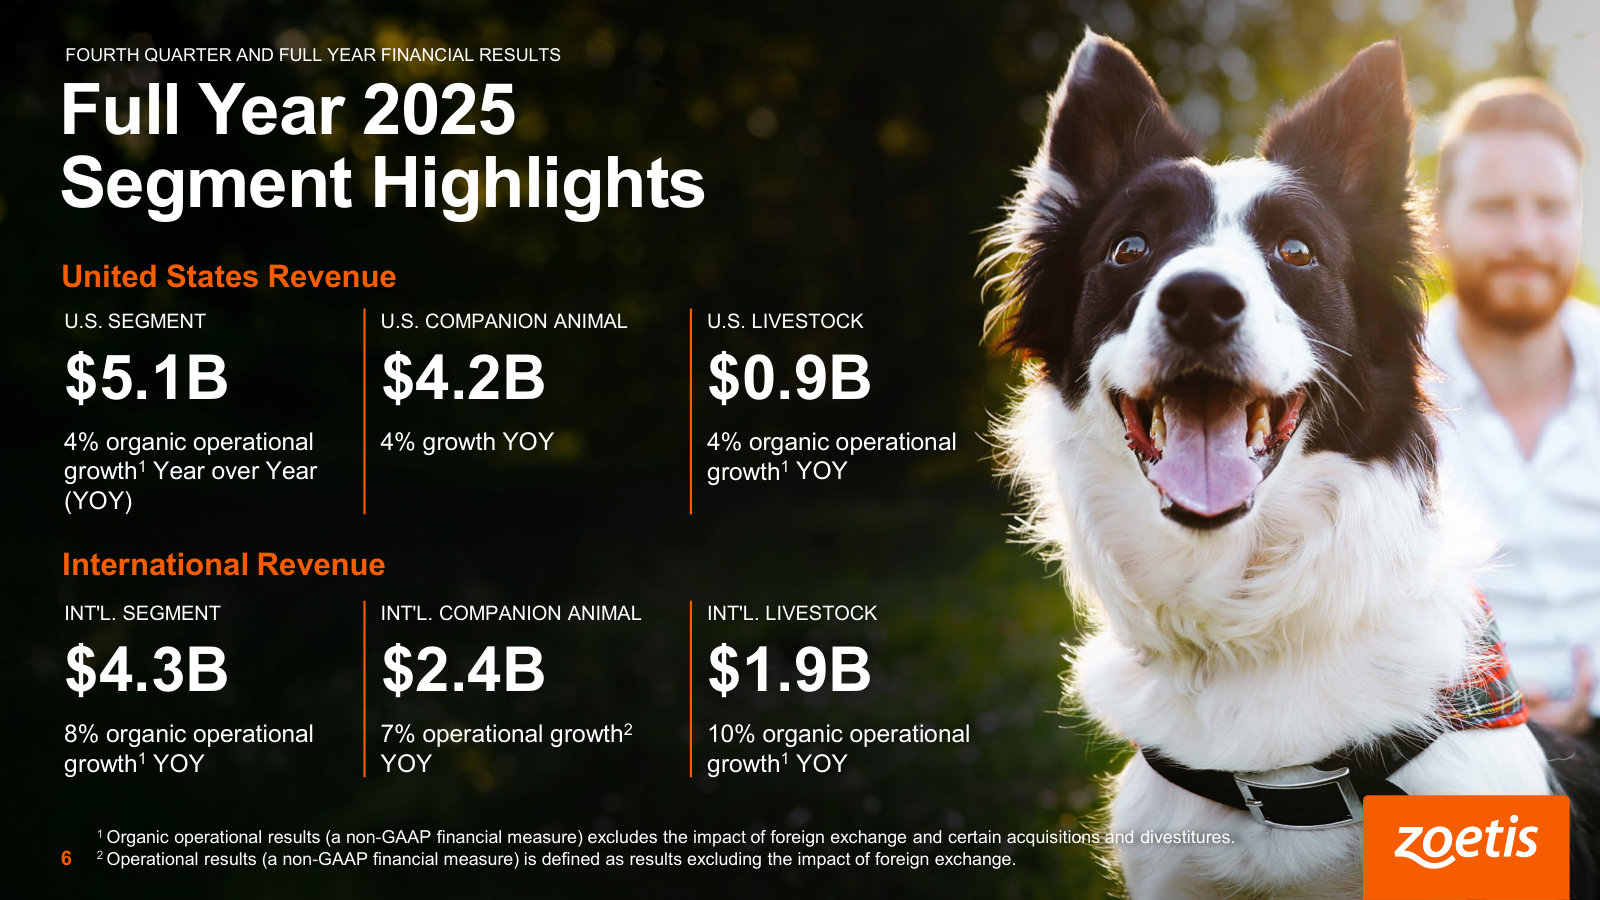
| U.S. Revenue | 4,042 | 4,313 | 4,555 | 5,074 | 5,097 |
| U.S. Earnings | 2,569 | 2,763 | 2,863 | 3,336 | 3,438 |
| U.S. Gross Margin | 80.5% | 81.4% | 80.2% | 81.6% | 83.5% |
| International Revenue | 3,652 | 3,681 | 3,911 | 4,102 | 4,254 |
| International Earnings | 1,948 | 1,990 | 2,037 | 2,118 | 2,264 |
| International Gross Margin | 69.7% | 70.6% | 68.4% | 68.0% | 69.2% |
| Total operating segments | 4,517 | 4,753 | 4,900 | 5,454 | 5,702 |
Source: Form 10-K Note 19 — Segment Information (U.S. and International reportable segments) [9] [10] [11] [12]. Click any linked figure to open the filing page with the row highlighted.
Income Statement
Source: Consolidated Statements of Income [1] [2] [3] [4]. Click any linked figure to open the filing page with the row highlighted.
Columns marked E are consensus analyst estimates shown alongside reported results for direct comparison; they are not company guidance.
Estimate source: Yahoo Finance analyst consensus, as of 2026-07-20. Estimate figures link to the consensus source, not to filing pages.
Balance Sheet
Source: Consolidated Balance Sheets [13] [14] [15] [16]. Click any linked figure to open the filing page with the row highlighted.
Cash Flow
Source: Consolidated Statements of Cash Flows [17] [18] [19] [20]. Click any linked figure to open the filing page with the row highlighted.
Non-GAAP Operating Results
| Non-GAAP Operating Results | FY2021 | FY2022 | FY2023 | FY2024 | FY2025 |
|---|---|---|---|---|---|
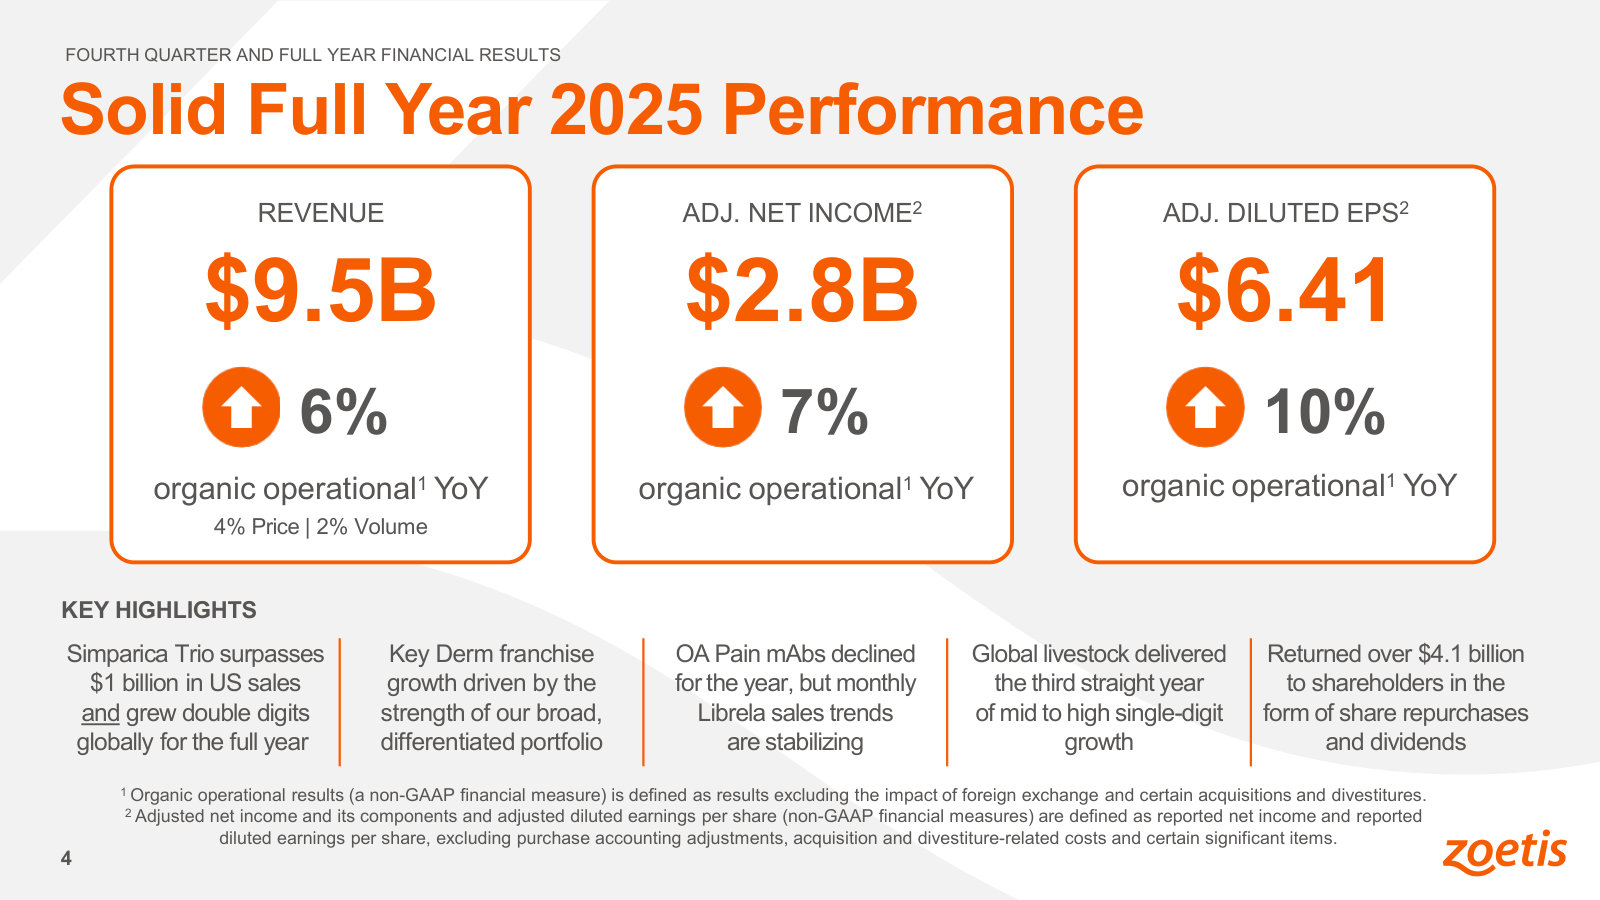
| Adjusted net income | 2,240 | 2,297 | 2,457 | 2,693 | 2,847 |
| Adjusted diluted EPS | 4.70 | 4.88 | 5.32 | 5.92 | 6.41 |
| Effective tax rate on adjusted pretax income | 18.6% | 20.3% | 20.1% | 19.8% | 20.3% |
Source: company filings [21] [22] [23]. Click any linked figure to open the filing page with the row highlighted.
Reported Margins Returns
| Reported Margins Returns | FY2021 | FY2022 | FY2023 | FY2024 | FY2025 |
|---|---|---|---|---|---|
| Cost of sales (% of revenue) | 29.6% | 30.4% | 30.0% | 29.4% | 28.2% |
| Income before income taxes (% of revenue) | 32.0% | 33.0% | 34.0% | 34.0% | 35.0% |
| Net income (% of revenue) | 26.0% | 26.0% | 27.0% | 27.0% | 28.0% |
| Effective tax rate | 18.2% | 20.5% | 20.3% | 20.3% | 20.4% |
Source: company filings [24] [25]. Click any linked figure to open the filing page with the row highlighted.
Capital Returns to Shareholders
| Capital Returns to Shareholders | FY2021 | FY2022 | FY2023 | FY2024 | FY2025 |
|---|---|---|---|---|---|
| Dividends declared per common share | 1.07 | 1.35 | 1.56 | 1.80 | 2.03 |
| Dividends declared | 509 | 631 | 716 | 812 | 897 |
| Common shares repurchased (millions) | 4 | 10 | 6 | 10 | 24 |
Source: company filings [26] [1] [27] [3]. Click any linked figure to open the filing page with the row highlighted.
People Innovation
| People Innovation | FY2021 | FY2022 | FY2023 | FY2024 | FY2025 |
|---|---|---|---|---|---|
| Total employees (worldwide) | 12,100 | 13,800 | 14,100 | 13,800 | 14,500 |
| Global voluntary attrition rate | — | — | — | 8.0% | 7.0% |
| R D employees (global) | — | — | — | — | 1,700 |
| Sales organization (field force) | — | — | — | — | 3,900 |
Source: company filings [28] [29] [30] [31]. Click any linked figure to open the filing page with the row highlighted.
Long-Term Record
| Fiscal year | Total revenue | Net income attributable to Zoetis Inc. | Diluted earnings per share | Operating cash flow | Capital expenditures |
|---|---|---|---|---|---|
| FY2016 | 4,888 | 821 | 1.65 | 713 | 216 |
| FY2017 | 5,307 | 864 | 1.75 | 1,346 | 224 |
| FY2018 | 5,825 | 1,428 | 2.93 | 1,790 | 338 |
| FY2019 | 6,260 | 1,500 | 3.11 | 1,795 | 460 |
| FY2020 | 6,675 | 1,638 | 3.42 | 2,126 | 453 |
| FY2021 | 7,776 | 2,037 | 4.27 | 2,213 | 477 |
| FY2022 | 8,080 | 2,114 | 4.49 | 1,912 | 586 |
| FY2023 | 8,544 | 2,344 | 5.07 | 2,353 | 732 |
| FY2024 | 9,256 | 2,486 | 5.47 | 2,953 | 655 |
| FY2025 | 9,467 | 2,673 | 6.02 | 2,904 | 621 |
Source: consolidated statements across filings; older years from the standardized feed [17] [1] [18] [2]. Click any linked figure to open the filing page with the row highlighted.
Analyst Consensus
Current price
Mean target
Median target
High target
Low target
Estimate source: Yahoo Finance analyst consensus, as of 2026-07-20. Estimate figures link to the consensus source, not to filing pages.
Traceability
369 of 394 figures on this page (94%) link to the filing page where they are printed — click a linked figure to open the source PDF at that page with the row highlighted. Unlinked figures come from standardized data feeds or pre-filing years.
Every FY2021–FY2025 figure in the four core statements and the segment table is taken from that year's own Zoetis Form 10-K (each 10-K prints three years of income/cash-flow and two years of balance sheet); each cell links to the exact statement page.
Revenue breakdown uses Zoetis' reported 'Revenue by species' disaggregation (Note 4). Companion Animal and Livestock are the printed species subtotals; a Contract manufacturing human health line and a Total Revenue row complete the split.
The Operating Segments statement shows Zoetis' two reportable segments (U.S. and International) with segment revenue, segment earnings and gross margin, reconciled by 'Total operating segments' earnings (Note 19, Selected Statement of Income Information).
FY2016–FY2020 figures in the Long-Term Record are from the standardized SEC XBRL data feed and are shown without page links (those filings are not in the corpus).
FY2025 was recast in the Q1 FY2026 Form 10-Q (footnote (a)); the numeric feed reflects the recast basis while the annual columns here reflect the as-filed FY2025 10-K. See discrepancies.
Quarterly cash-flow single quarters are derived from printed year-to-date statements and were cross-checked against the quarterly data feed (Q3 FY25 $938M, Q4 FY25 $893M, Q1 FY26 $401M operating cash flow all agree).
4 figure(s) differed between the data feed and the filing; the filing value is shown (see the run's metrics/metrics_tab.json for the audit trail).
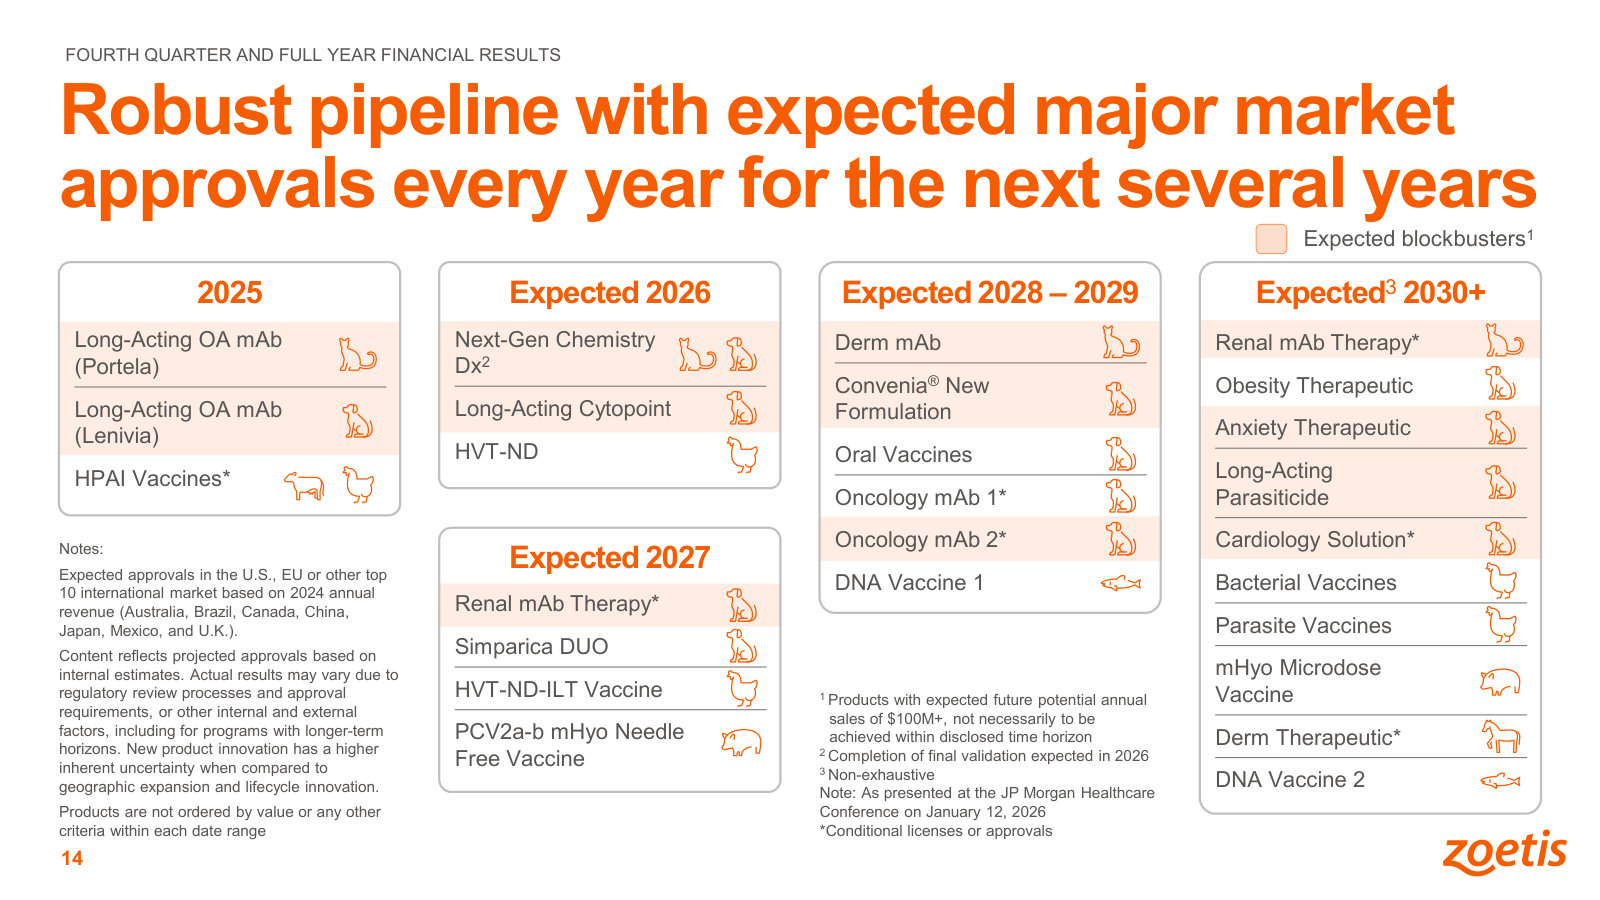
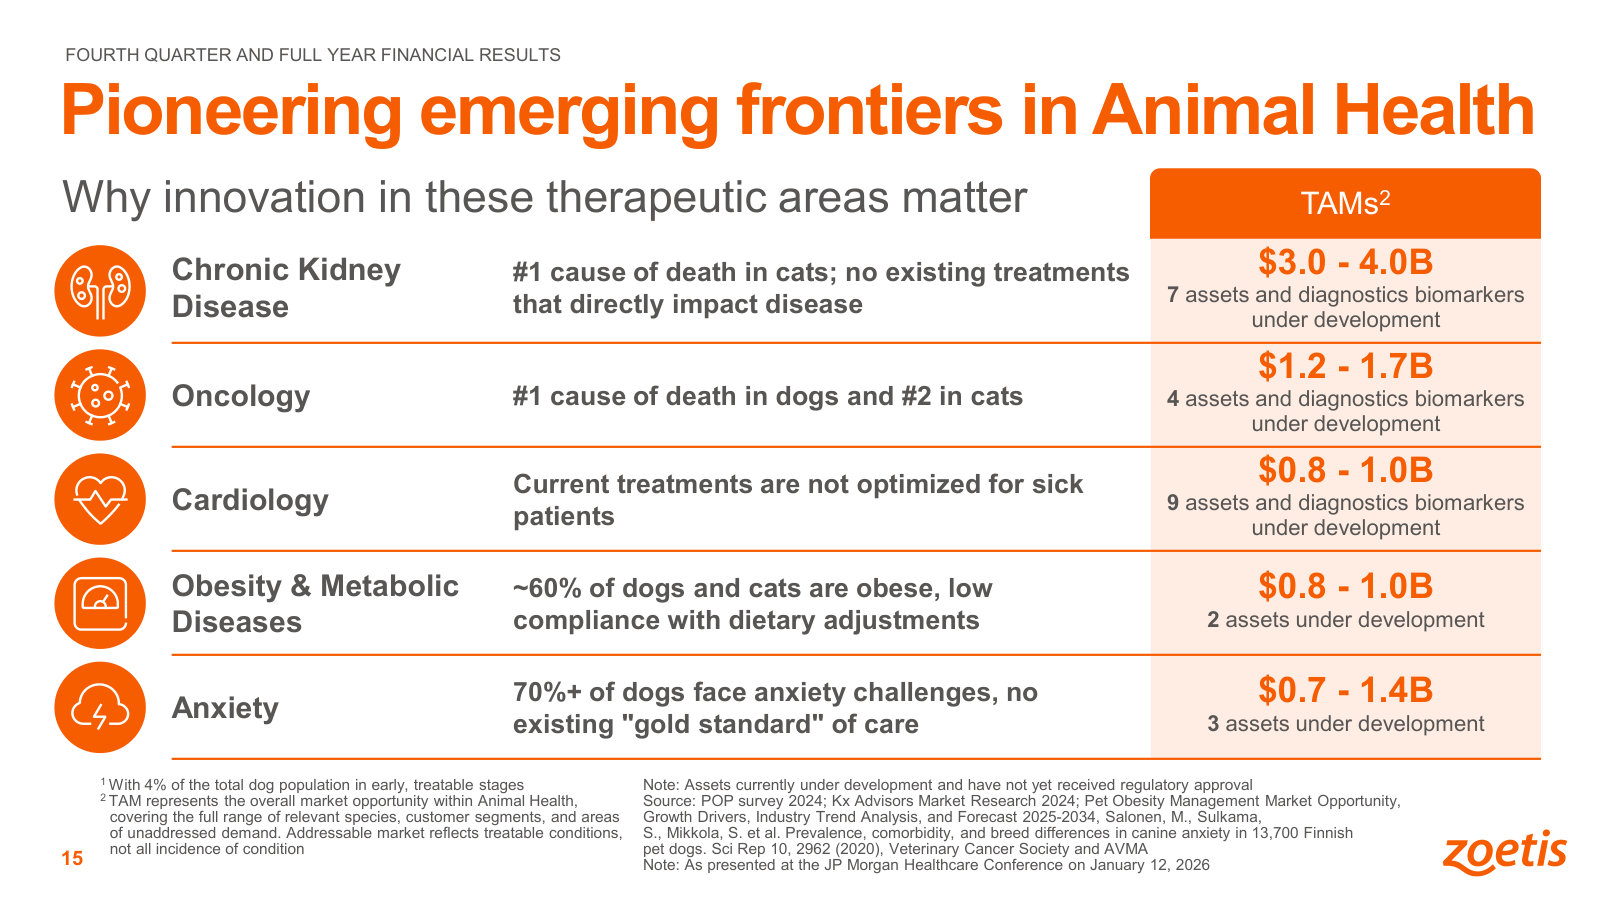
Zoetis Inc.'s management explains the business in its own materials. The slides below do the most of that work, pulled from the documents preserved in Sources. Each source link opens the complete presentation at that slide in a new tab.
Fourth Quarter and Full Year 2025 Financial Results — FY 2025
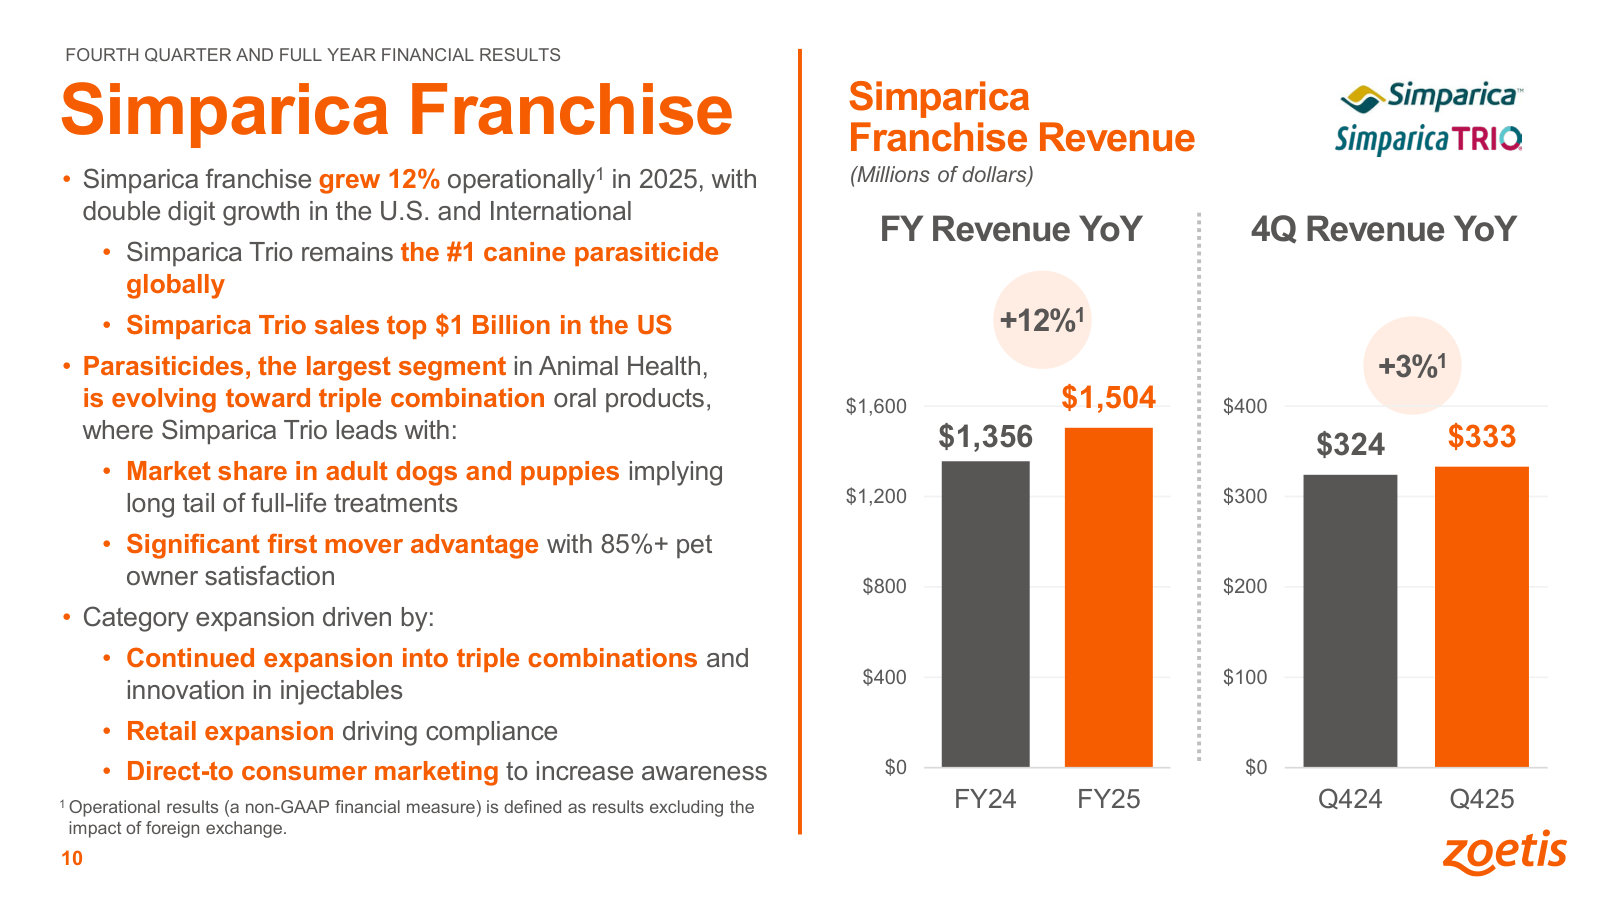
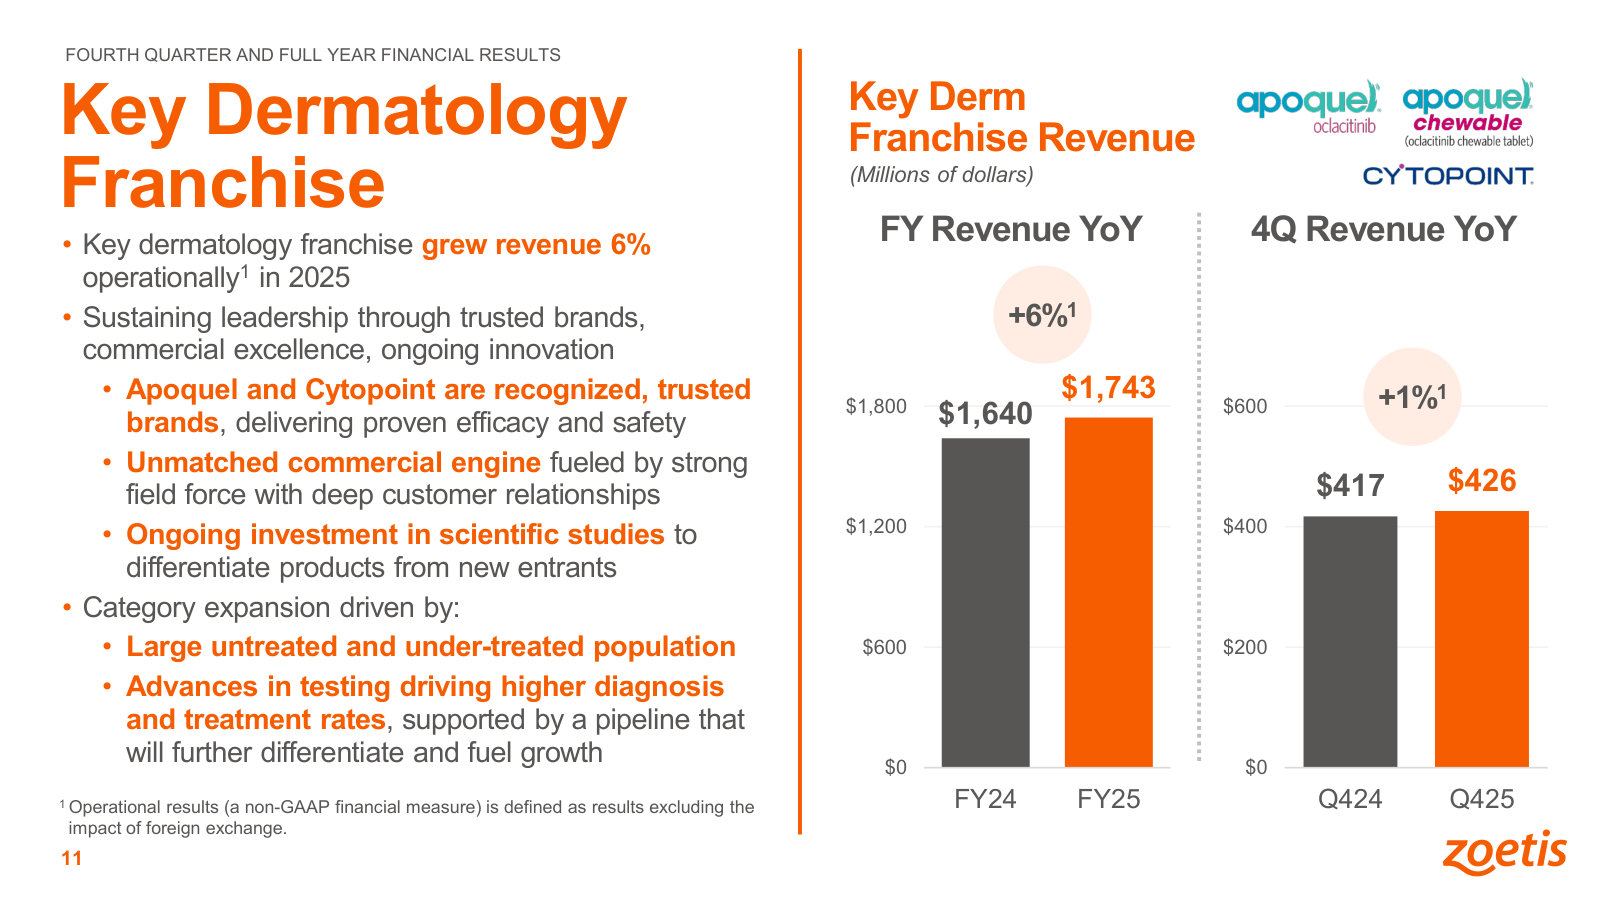
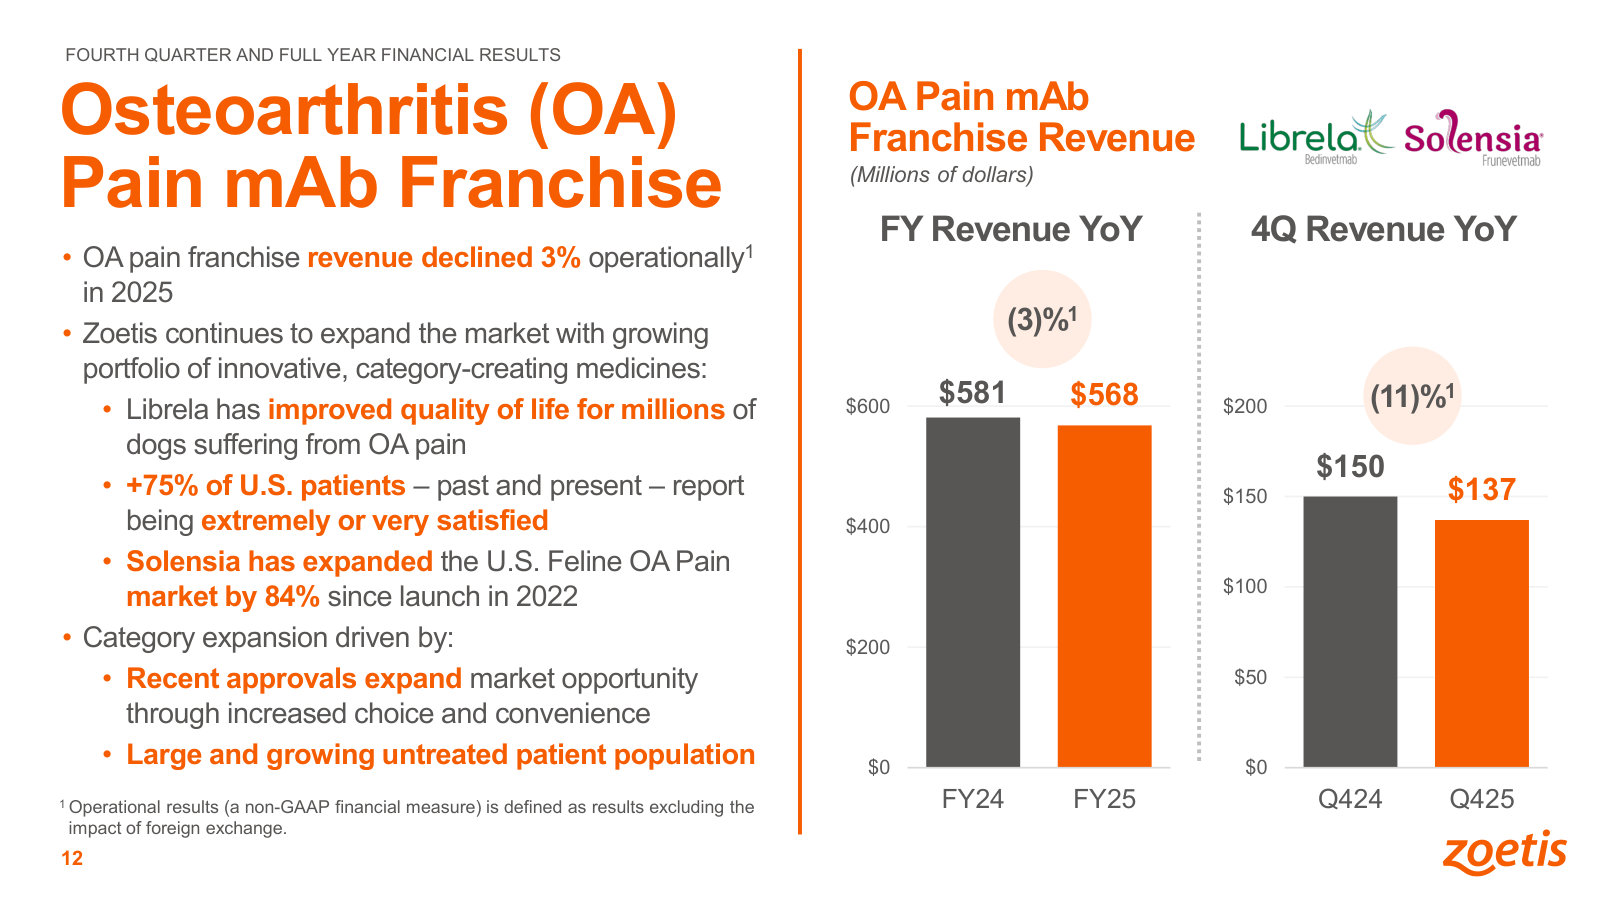
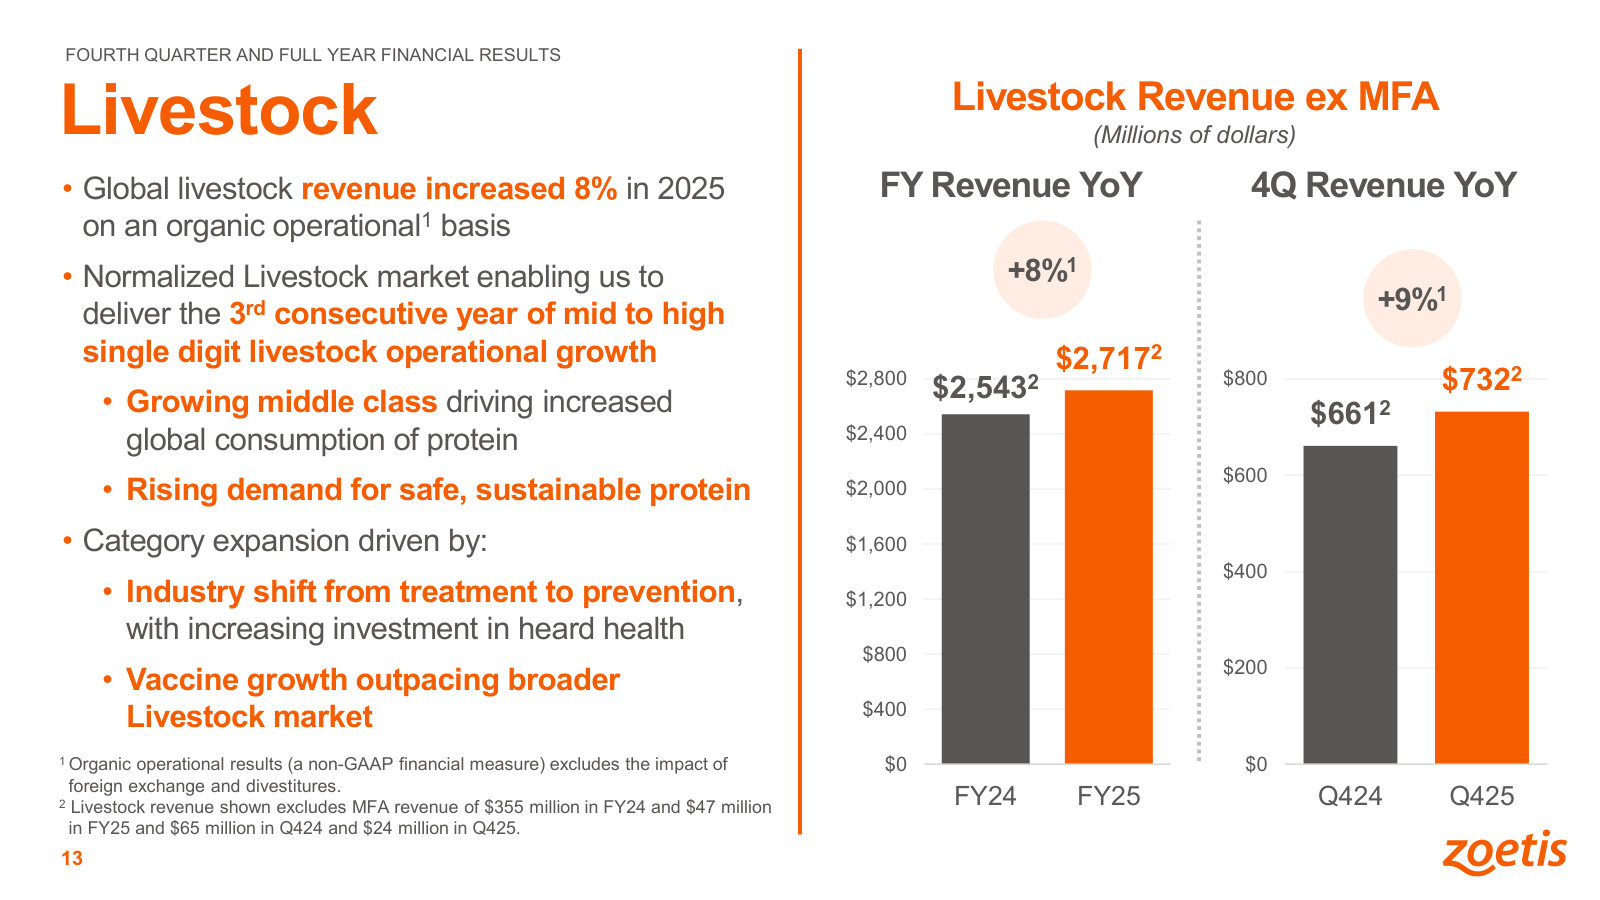
The fullest current-state deck: full-year segment and franchise performance, the approval pipeline and the emerging-market opportunities behind future growth. · Open the full document →
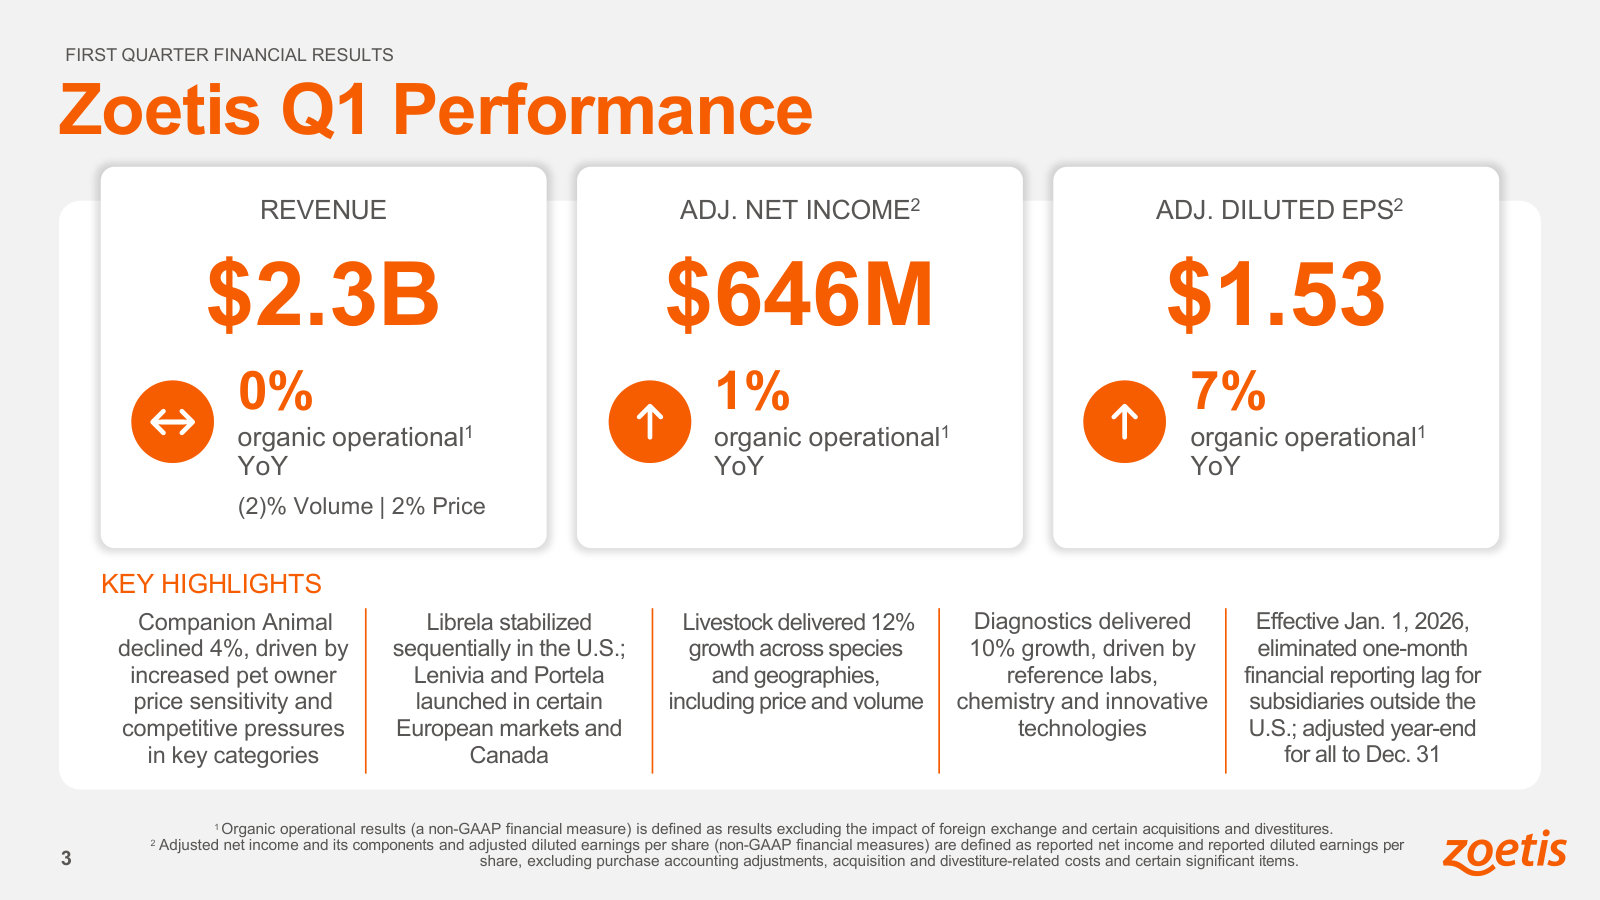
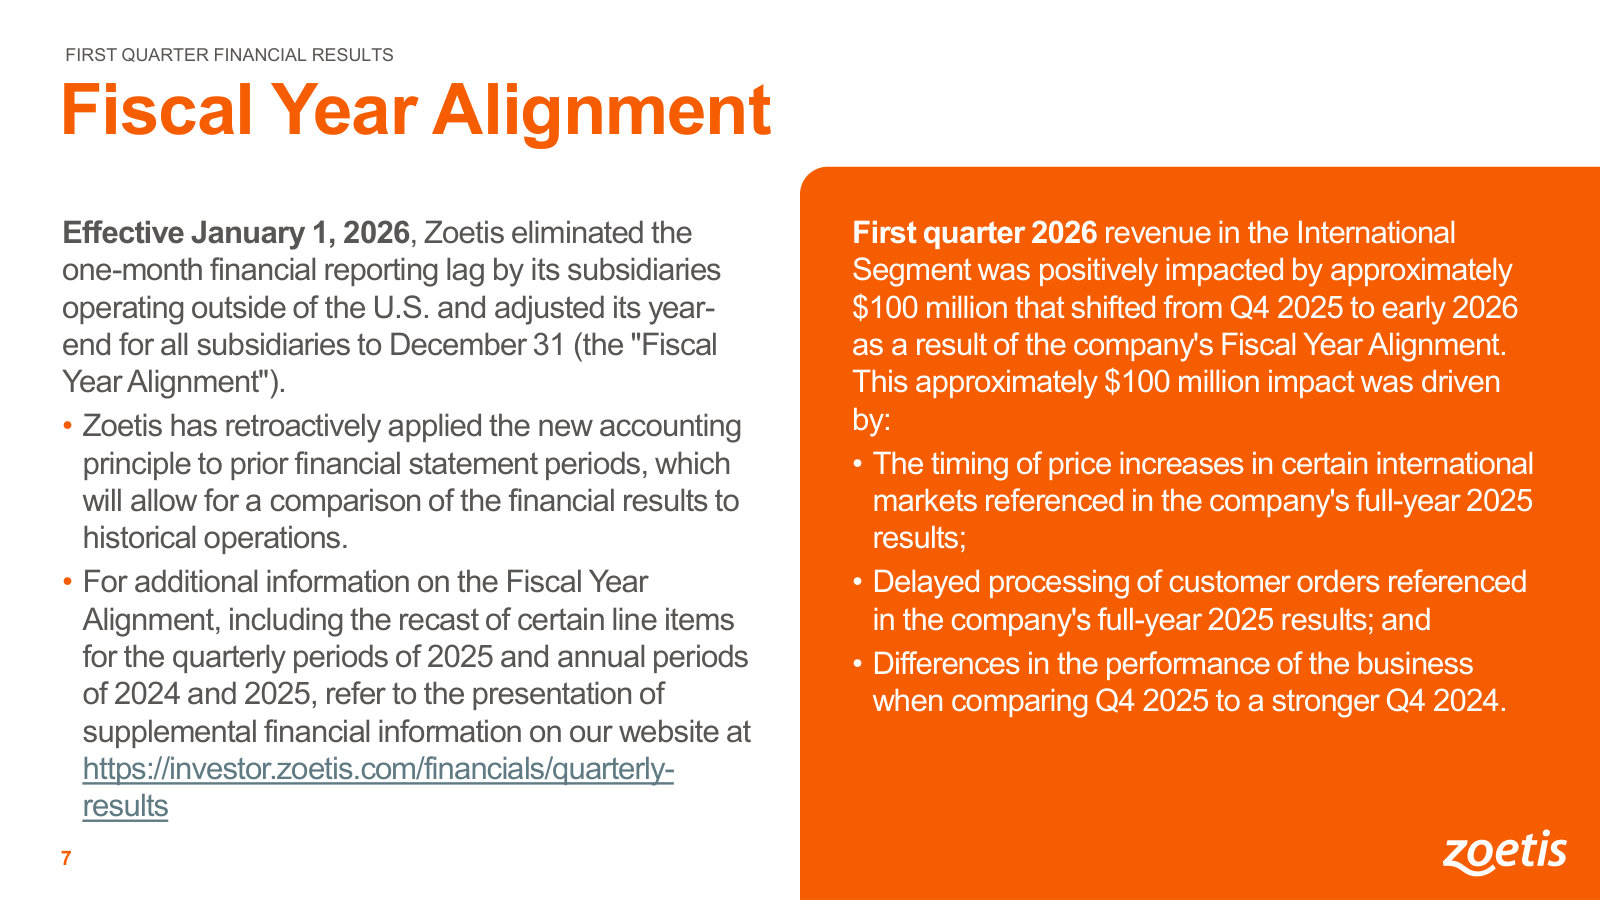
First Quarter 2026 Financial Results — Q1 2026
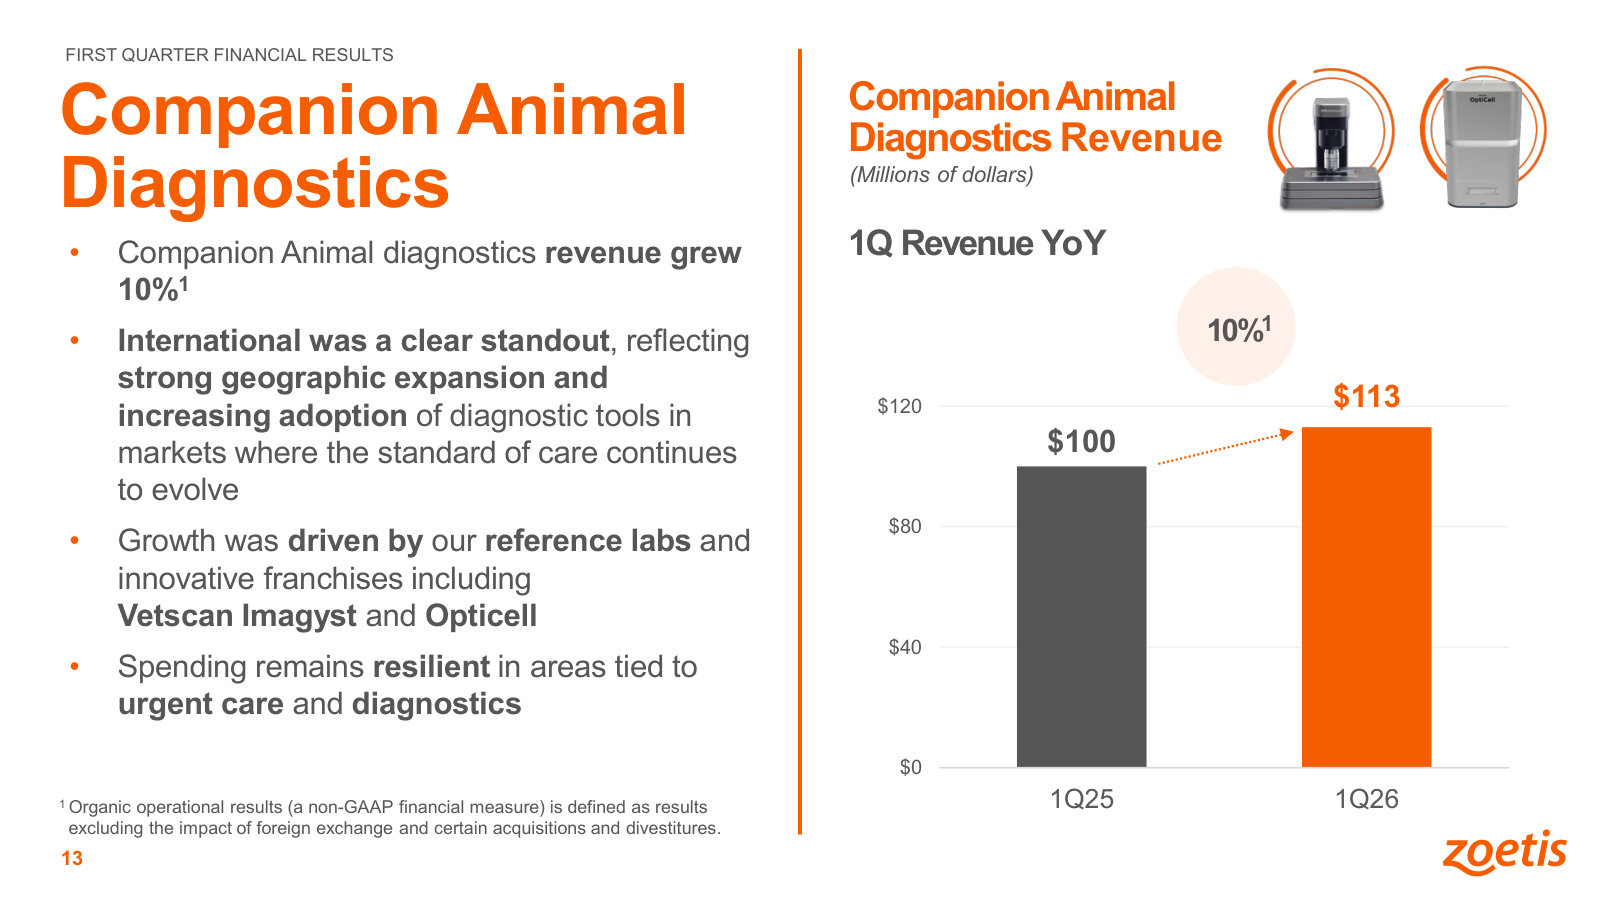
The latest deck, featured for what the annual deck lacks: the current-quarter picture, the fiscal-year accounting change, the growth strategy and the diagnostics franchise. · Open the full document →
Fourth Quarter and Full Year 2024 Financial Results — FY 2024
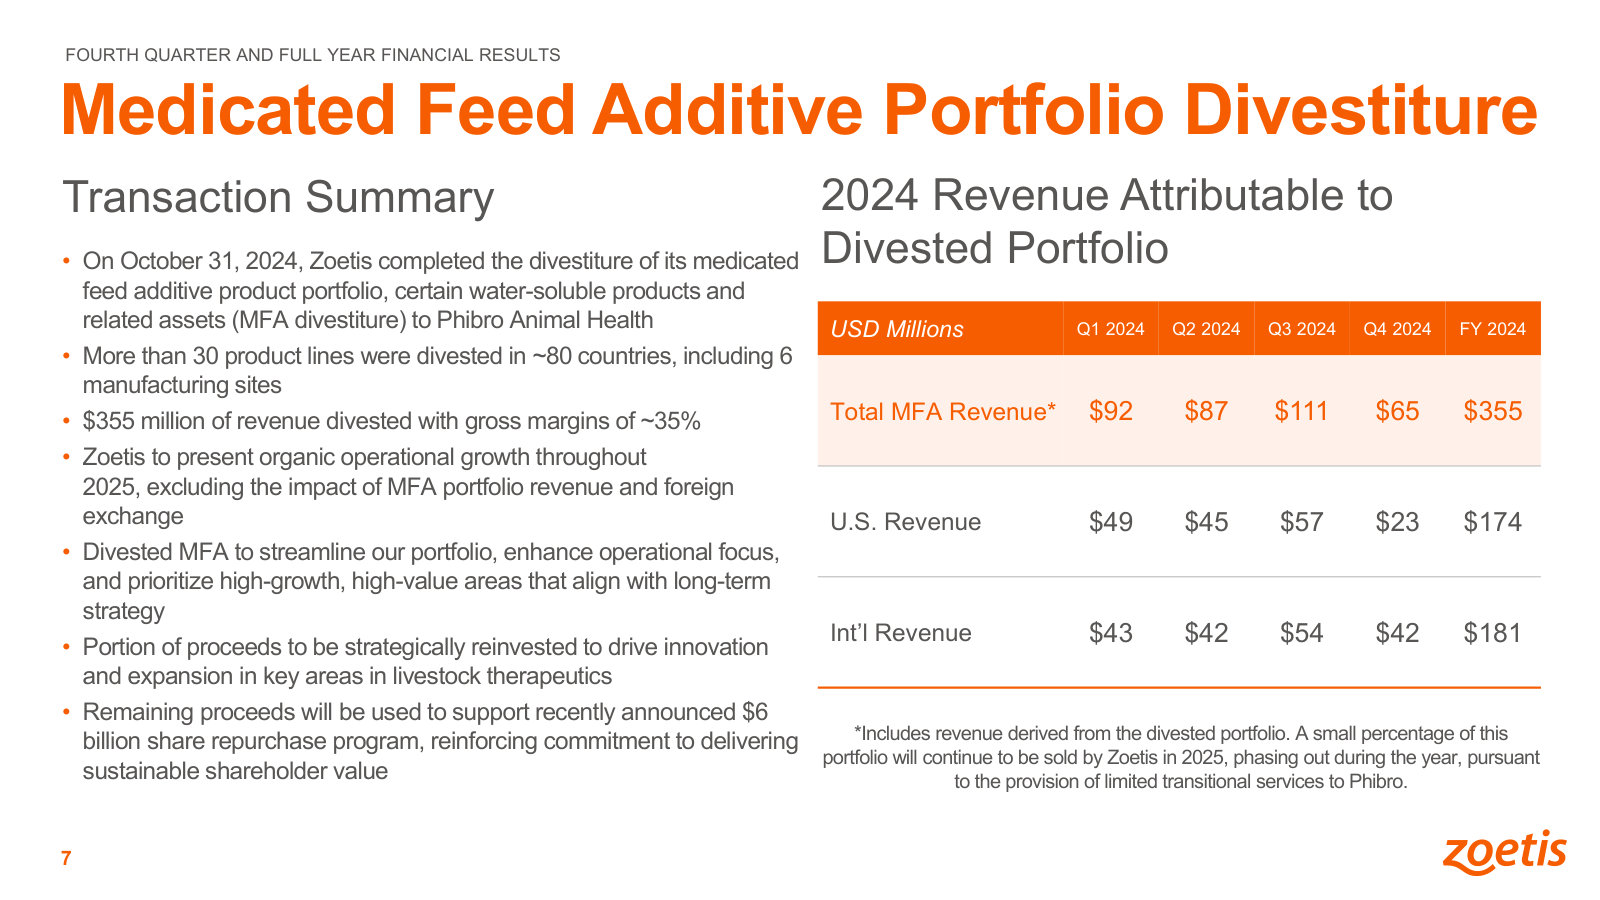
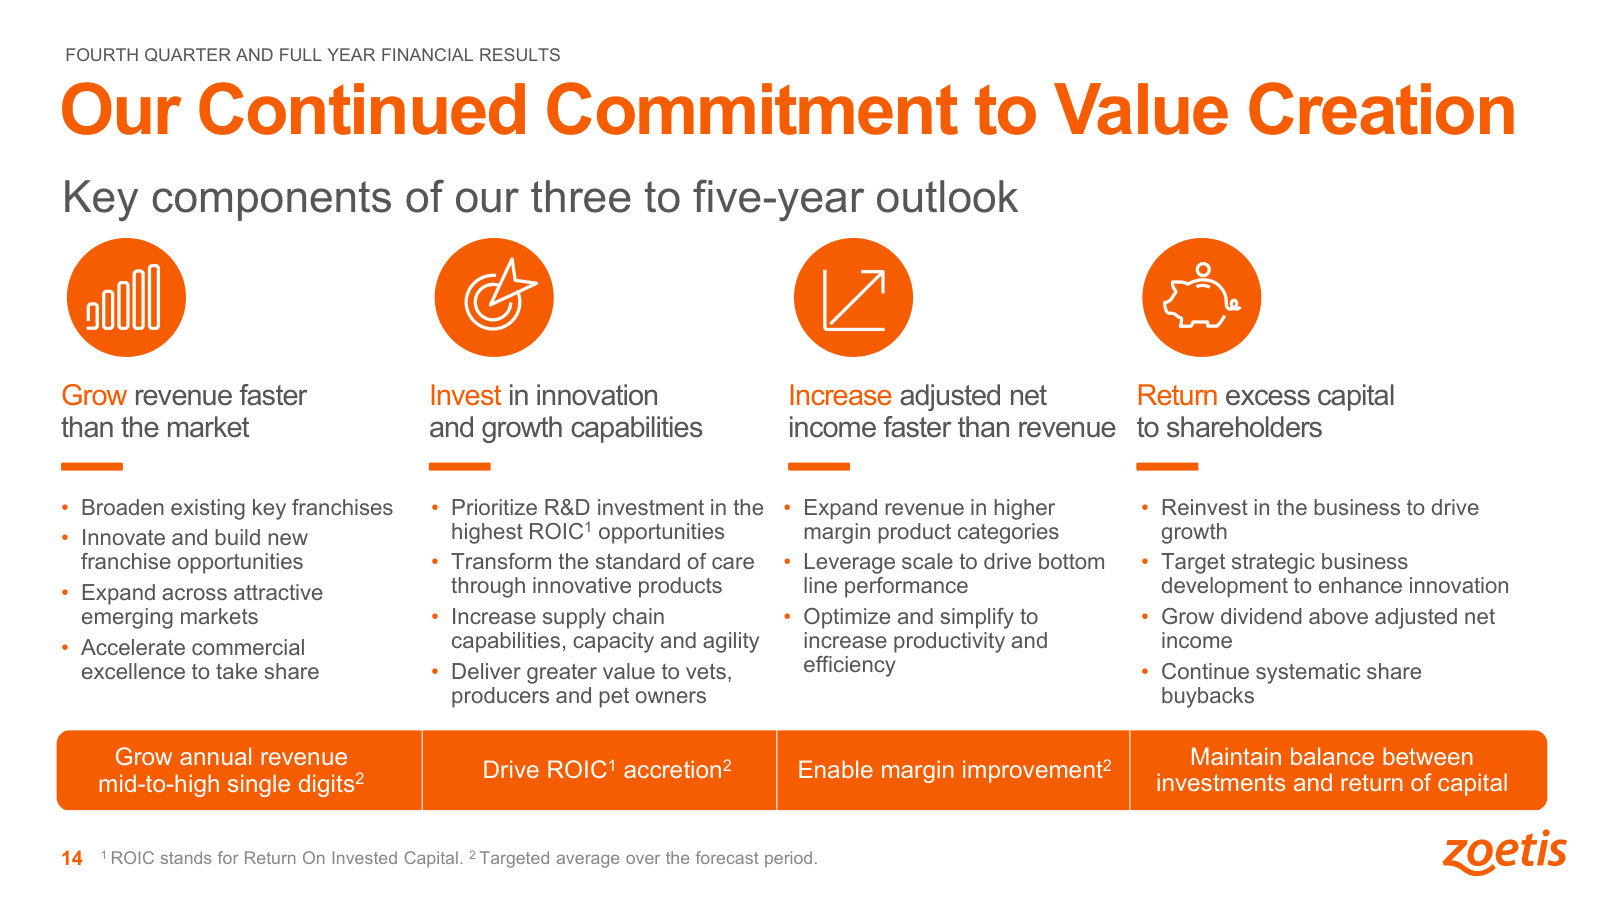
Kept for two slides the newer decks dropped: the value-creation framework management runs on, and the MFA divestiture behind every 'ex-MFA' comparison. · Open the full document →
Zoetis Inc.'s management answers for the business every quarter. These are the exchanges that explain it best — verbatim, from the call transcripts preserved in Sources. Each link opens the full transcript at that page in a new tab.
Q1 FY2026 Earnings Call — Q1 FY2026
The clearest single account of how a premium market leader's model gets exposed when price sensitivity, weak clinic traffic and low-price competition converge with no market growth — the quarter guidance was cut. · Open the full transcript →
Pricing philosophy under fire: Zoetis will not lead on price — 'we are a premium innovative brand, and that is not going to change.'
Christopher Schott (JPMorgan); Kristin Peck (CEO): Just two for me. Can you comment on your latest assumptions around pricing this year given the promotional activity you're seeing from competitors? Are you reacting on price, or should we be thinking about near-term share loss? […] Sure. I'll start on the price one and then Wetteny can take the guide. As we've always said, we are not planning to compete through price as our main strategy. Our focus, as always, will remain on our differentiated portfolio, the breadth of it, the service we provide and execution. We are a premium innovative brand, and that is not going to change. We did take price, as you saw in the quarter. I think we can continue and Wetteny can talk where it is relative to historic price challenges. Obviously, in areas where we've seen generic competition, we have taken selective price actions there. We'll obviously continue to leverage promotions. But our priority remains innovation, differentiation and service to our customers.
p. 9 · Read in context →
Q4 & Full Year 2024 Earnings Call — Q4 FY2024
The fullest statement of the operating model and value proposition — how diversified drivers create and expand markets, plus the Librela safety resolution and capital-allocation record. · Open the full transcript →
The operating model in one paragraph: diversified drivers that create and expand markets — like the triple-combo category Trio pioneered.
Kristin Peck (CEO): Our confidence is rooted in the diversity of our business model where multiple growth drivers, powered by scientific innovation and commercial excellence, work together to create and expand markets. This combination ensures that our market-leading franchises deliver long, and in some cases decades-long growth tailwinds with significant room for further expansion. While Wetteny will discuss the quarter, I want to highlight some of the drivers that will carry us into 2025. Our global Simparica franchise grew 28% operationally on the year, even amidst competition. This success is fueled by the ongoing shift for triple combination treatments, a market that has grown over 40% in the past 12 months. Currently valued at $2 billion, the global triple combination market pioneered and led by Simparica Trio in the US is projected to more than double to $4.5 billion by 2028.
p. 1 · Read in context →
Capital allocation in practice: a record $1.9B buyback, a 15% dividend raise and $2.6B total returned to shareholders in 2024.
Wetteny Joseph (CFO): In 2024, we repurchased $1.9 billion of Zoetis shares, the most in our history. We also reaffirmed our commitment to buying back shares in August when our Board approved a new multiyear $6 billion share repurchase program. Additionally, we increased our dividend rate by 15% during the year while distributing $786 million back to shareholders. In total, we returned over $2.6 billion to shareholders in 2024, an increase of over $800 million versus the prior year.
p. 4 · Read in context →
Where future growth comes from: new categories with large TAMs — chronic kidney disease $3–4B, oncology $1.2–1.7B — plus long-acting mAbs.
Balaji Prasad (Barclays); Kristin Peck (CEO): I can pick up the second question on the TAM for the new product categories. I mean I wanted to start with, we have more drivers of growth to improve the standard of care than any other company. We talked about in our pipeline, we have multiple blockbusters. And at JPMorgan, we discussed what the total addressable market for some of these new therapies would be. To your point, in the 12 to 36 months window, we have chronic kidney disease products. As we mentioned, that's a $3 billion to $4 billion market. We also mentioned oncology, and that's a $1.2 billion to $1.7 billion market. Then in the longer term, we were also talking about cardiology. I also just want to double-click for a second on the long-acting portfolio because I really think these are going to be significant growth drivers. There's a lot of people who can make it every month. So, it will both increase compliance, which will grow the market as well as meet a lot of pet owners who just, the monthly too much for them, and they would be much more convenient to come in four times a year versus 12 times a year. So, we really think as we look at potential approvals, approval every year for the next several years and really more drivers of growth for the short, medium, and long term for the company, we remain really excited about the potential unmet needs that we can address.
p. 10 · Read in context →
Q1 FY2024 Earnings Call — Q1 FY2024
The call where the thesis was tested — the Librela safety scare — met head-on, alongside the clearest explanation of how Zoetis creates and monetizes new categories. · Open the full transcript →
How Zoetis makes money — it creates categories: parasiticides took it from #5 to #2; dermatology grew from a ~$100M market to $1.4B.
Kristin Peck (CEO): Science has created something completely unique to our industry: two $1 billion franchises. Our parasiticide portfolio expanded the total market based on deep customer insights. Before Simparica and Simparica Trio, we were #5 in this category. These innovations changed how we compete. Today, we are #2 and continue gaining share and growing the market even in the face of competition. Similarly, we were the first to recognize that new therapies were needed to treat canine itch safely and effectively. That market foresight changed the treatment paradigm and revolutionized pet care. A decade of dermatology has led to three products: 20 major life cycle enhancements, including Cytopoint, the first-ever animal health monoclonal antibody, and the first chewable with Apoquel chew. From what was once believed to be just a $100 million market, it has grown to $1.4 billion because we know what our customers need.
p. 2 · Read in context →
More calls
Q4 & Full Year 2025 Earnings Call — Q4 FY2025 · 14 pages · The last call before the Q1 2026 downturn — where management framed full-year 2025 and set the original 2026 guidance and fiscal-year alignment that were cut three months later. · Open →
Q3 FY2025 Earnings Call — Q3 FY2025 · 10 pages · Read here for the mid-2025 trajectory and the first signs of the competition and consumer pressure that intensified into 2026. · Open →
Q1 FY2025 Earnings Call — Q1 FY2025 · 13 pages · The first call of 2025, post-safety-resolution: momentum in Simparica, dermatology and OA pain before the market turned. · Open →
Q3 FY2024 Earnings Call — Q3 FY2024 · 14 pages · Peak Librela launch metrics (penetration, first-year revenue, patients treated) and the detail needed to model the MFA/water-soluble divestiture. · Open →
Q4 & Full Year 2023 Earnings Call — Q4 FY2023 · 40 pages · The US Librela launch economics and the four-tenet value proposition from Investor Day, including the >$1B OA-pain peak-sales framing (Motley Fool transcript). · Open →
Q4 & Full Year 2021 Earnings Call — Q4 FY2021 · 37 pages · The earliest annual call in the corpus — the origins of the OA-pain monoclonal-antibody franchise and the long-term growth model (Motley Fool transcript). · Open →
Zoetis Inc.'s annual reports contain management's most considered account of the business. These are the sections, passages and visual pages worth opening in the originals preserved in Sources.
Zoetis Inc. — FY2025 Annual Report (Form 10-K) — FY2025
The latest 10-K: management's own account of a two-segment, ~300-product-line animal-health leader and what drove 2025 results. · Open the full document →
Item 1. Business — p. 5 · Read the full section →
How Zoetis defines itself: a global animal-health leader across eight species, two segments (U.S. 54%, International 45%).
Zoetis in its own words — species, product categories and the scope of the business.
Zoetis Inc. is a global leader in the animal health industry, focused on the discovery, development, manufacture and commercialization of medicines, vaccines, diagnostic products and services, biodevices, genetic tests and precision animal health. We have a diversified business, commercializing products across eight core species: dogs, cats and horses (collectively, companion animals) and cattle, swine, poultry, fish and sheep (collectively, livestock); and within seven major product categories: parasiticides, vaccines, dermatology, anti-infectives, pain and sedation, other pharmaceutical and animal health diagnostics.
p. 5 · Read in context →
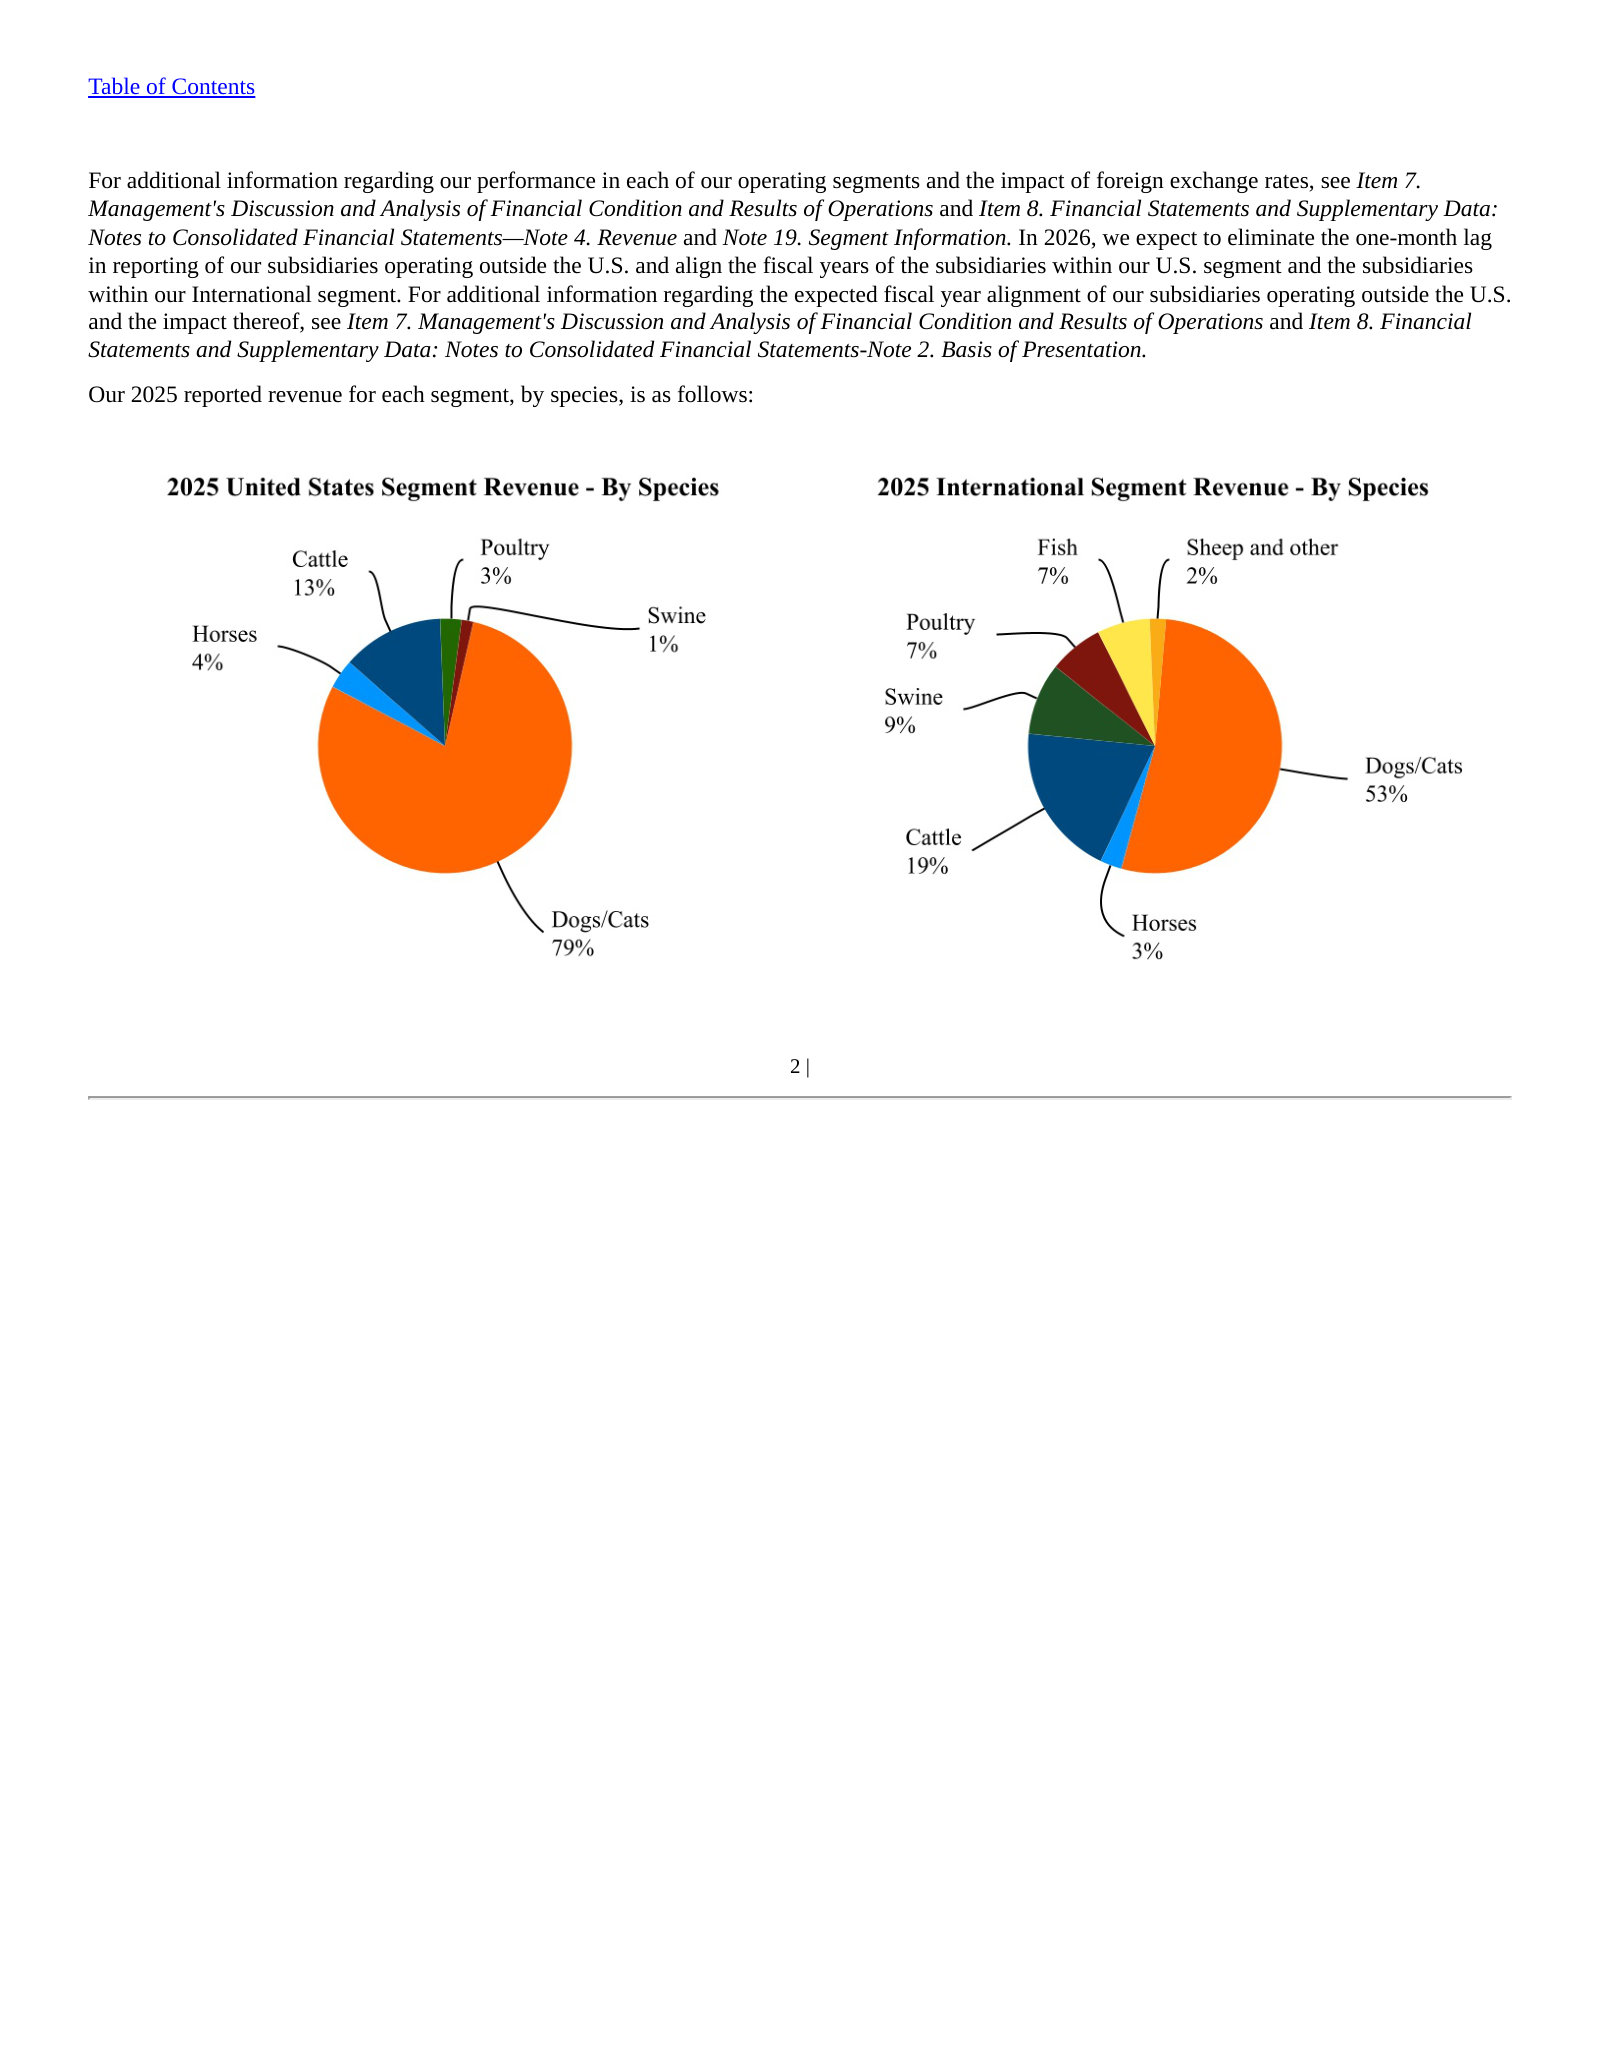
Products — p. 8 · Read the full section →
Where the money comes from: companion-animal products are ~70% of revenue, livestock ~29%, with different demand drivers.
Companion animal (~70% of revenue) vs. livestock (~29%) — the two demand engines contrasted.
Our companion animal products help extend and improve the quality of life for pets; increase convenience and compliance for pet owners; and help veterinarians improve the quality of their care and the efficiency of their businesses. Growth in the companion animal medicines, vaccines and diagnostics sectors is driven by increases in spending on pet care, economic development and related increases in disposable income. Companion animals are also living longer, deepening the human-animal bond, receiving increased medical treatment and benefiting from advances in animal health medicines, vaccines and diagnostics. Companion animal products represented approximately 70% of our revenue for the year ended December 31, 2025. […] Our livestock products focus on predicting, preventing, detecting and treating diseases, with the understanding that veterinarians and livestock producers must have the tools at their disposal to treat disease expeditiously, which in turn enables the sustainable production of safe, high-quality animal protein. Human population growth and increased standards of living continue to drive demand for increased production of quality animal protein. Population growth leads to greater consumption of natural resources, driving a need for innovative solutions to increase sustainability and productivity. As global food security takes on heightened importance, producers are tasked with facilitating a high quality, safe and reliable food supply. Livestock products represented approximately 29% of our revenue for the year ended December 31, 2025.
p. 8 · Read in context →
Item 1A. Risk Factors — p. 31 · Read the full section →
The company-specific risks that could actually bite: revenue concentration in a few blockbusters and post-launch safety concerns.
Five products — incl. Simparica Trio, Apoquel, Librela — are ~42% of 2025 revenue.
Some of our top-selling products or product lines have in the past or may in the future experience issues, such as loss of patent protection, material product liability litigation, new or unexpected side effects (or an increased frequency of serious, expected adverse events), manufacturing or supply chain disruptions, regulatory proceedings or enforcement, labeling changes, public regulatory communications, other regulatory correspondence, including “Dear Veterinarian” Letters, negative publicity or social media attention, changes to veterinarian or customer preferences, or ineffectiveness in connecting with veterinarians and customers and/or disruptive innovations or the introduction of competing and/or more effective products, our revenues could be negatively impacted, perhaps significantly. For example, our five top-selling products and product lines, Simparica/Simparica Trio, Apoquel/Apoquel Chewable, Cytopoint, Librela and our ceftiofur line, contributed approximately 42% of our revenue in 2025, and certain issues with these top-selling products and product lines could have a more significant impact to our results of operations.
p. 31 · Read in context →
Safety, quality or efficacy concerns can surface post-launch and force recalls or label changes.
Our products generally receive regulatory approval based on data obtained in controlled clinical trials. After approval and launch, the products are used for longer periods of time by much larger numbers of animals worldwide, which may lead to identifying new safety or efficacy concerns. […] Unanticipated safety, quality or efficacy concerns have, and could in the future, arise with respect to our products, whether or not scientifically or clinically supported, which have in the past and could in the future lead to product recalls, label changes or other measures that could reduce the product’s market acceptance
p. 31 · Read in context →
Item 7. Management's Discussion and Analysis of Financial Condition and Results of Operations — p. 62 · Read the full section →
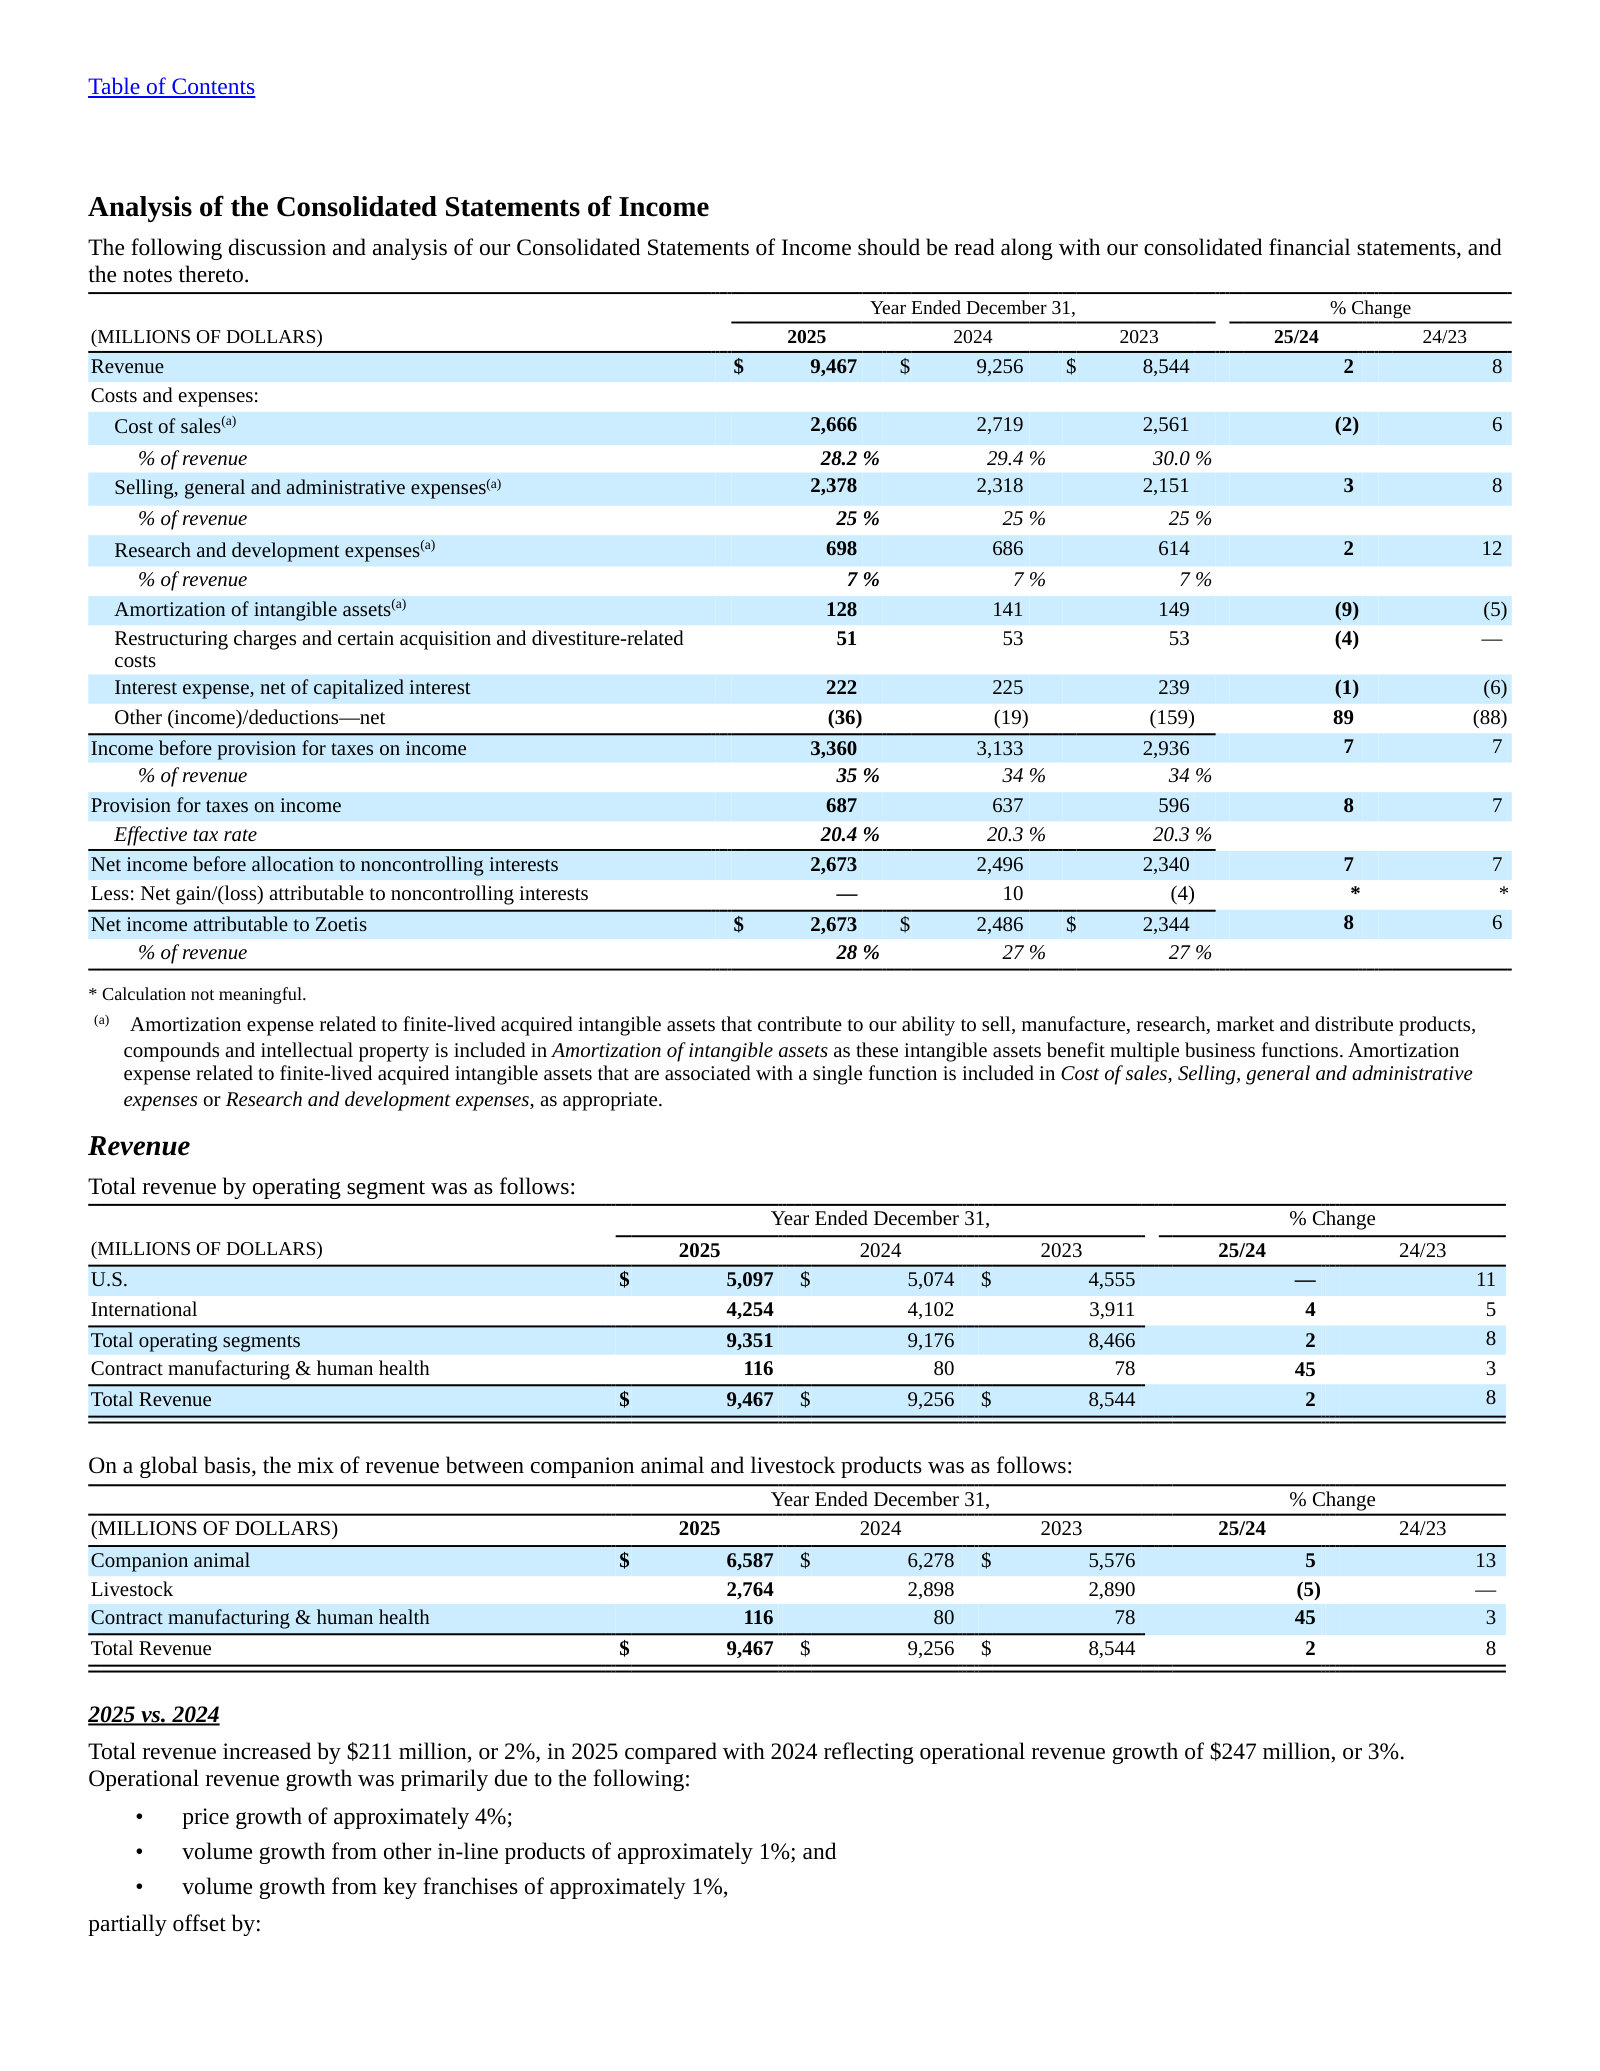
Management explains its strategy and walks 2025 results — revenue $9,467M, up 2% (3% operational), with the drivers laid out.
The strategic pillars: innovation-led growth across the portfolio and all core species.
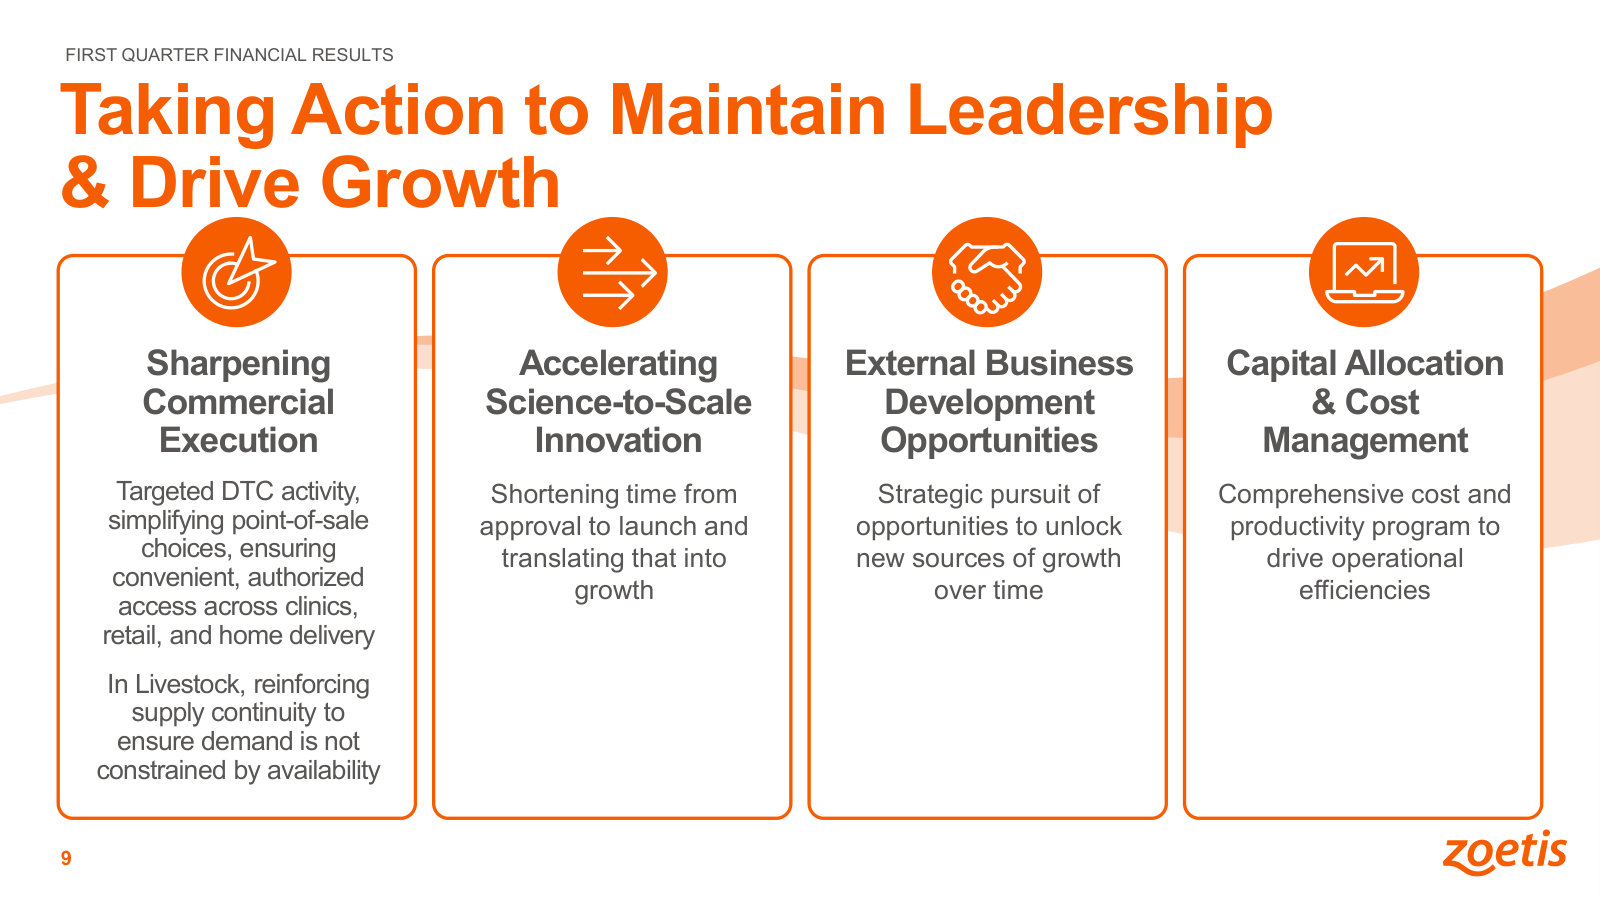
Our vision is to be the most trusted and valued animal health company, shaping the future of animal care through our innovation, customer obsession and purpose-driven colleagues. We have a global presence in both developed and emerging markets and across eight core species. We intend to grow our business by pursuing the following core strategies: […] Lead through innovation across our diverse portfolio - We seek to define the future of animal health by delivering new products and solutions as well as lifecycle innovations across the continuum of care that span from disease prediction and prevention to detection and treatment. We are focused on innovating across vaccines, pharmaceuticals, diagnostics, genetics, biodevices, and other product segments, and across all core species. Our internal R&D capabilities are differentiators, but we also collaborate across both academia and industry partners to ensure we are bringing the best possible innovations to our customers;
p. 66 · Read in context →
Item 7. MD&A — Operating Segment Results — p. 80 · Read the full section →
The segment discussion that separates operational from FX growth and names the products moving each segment.
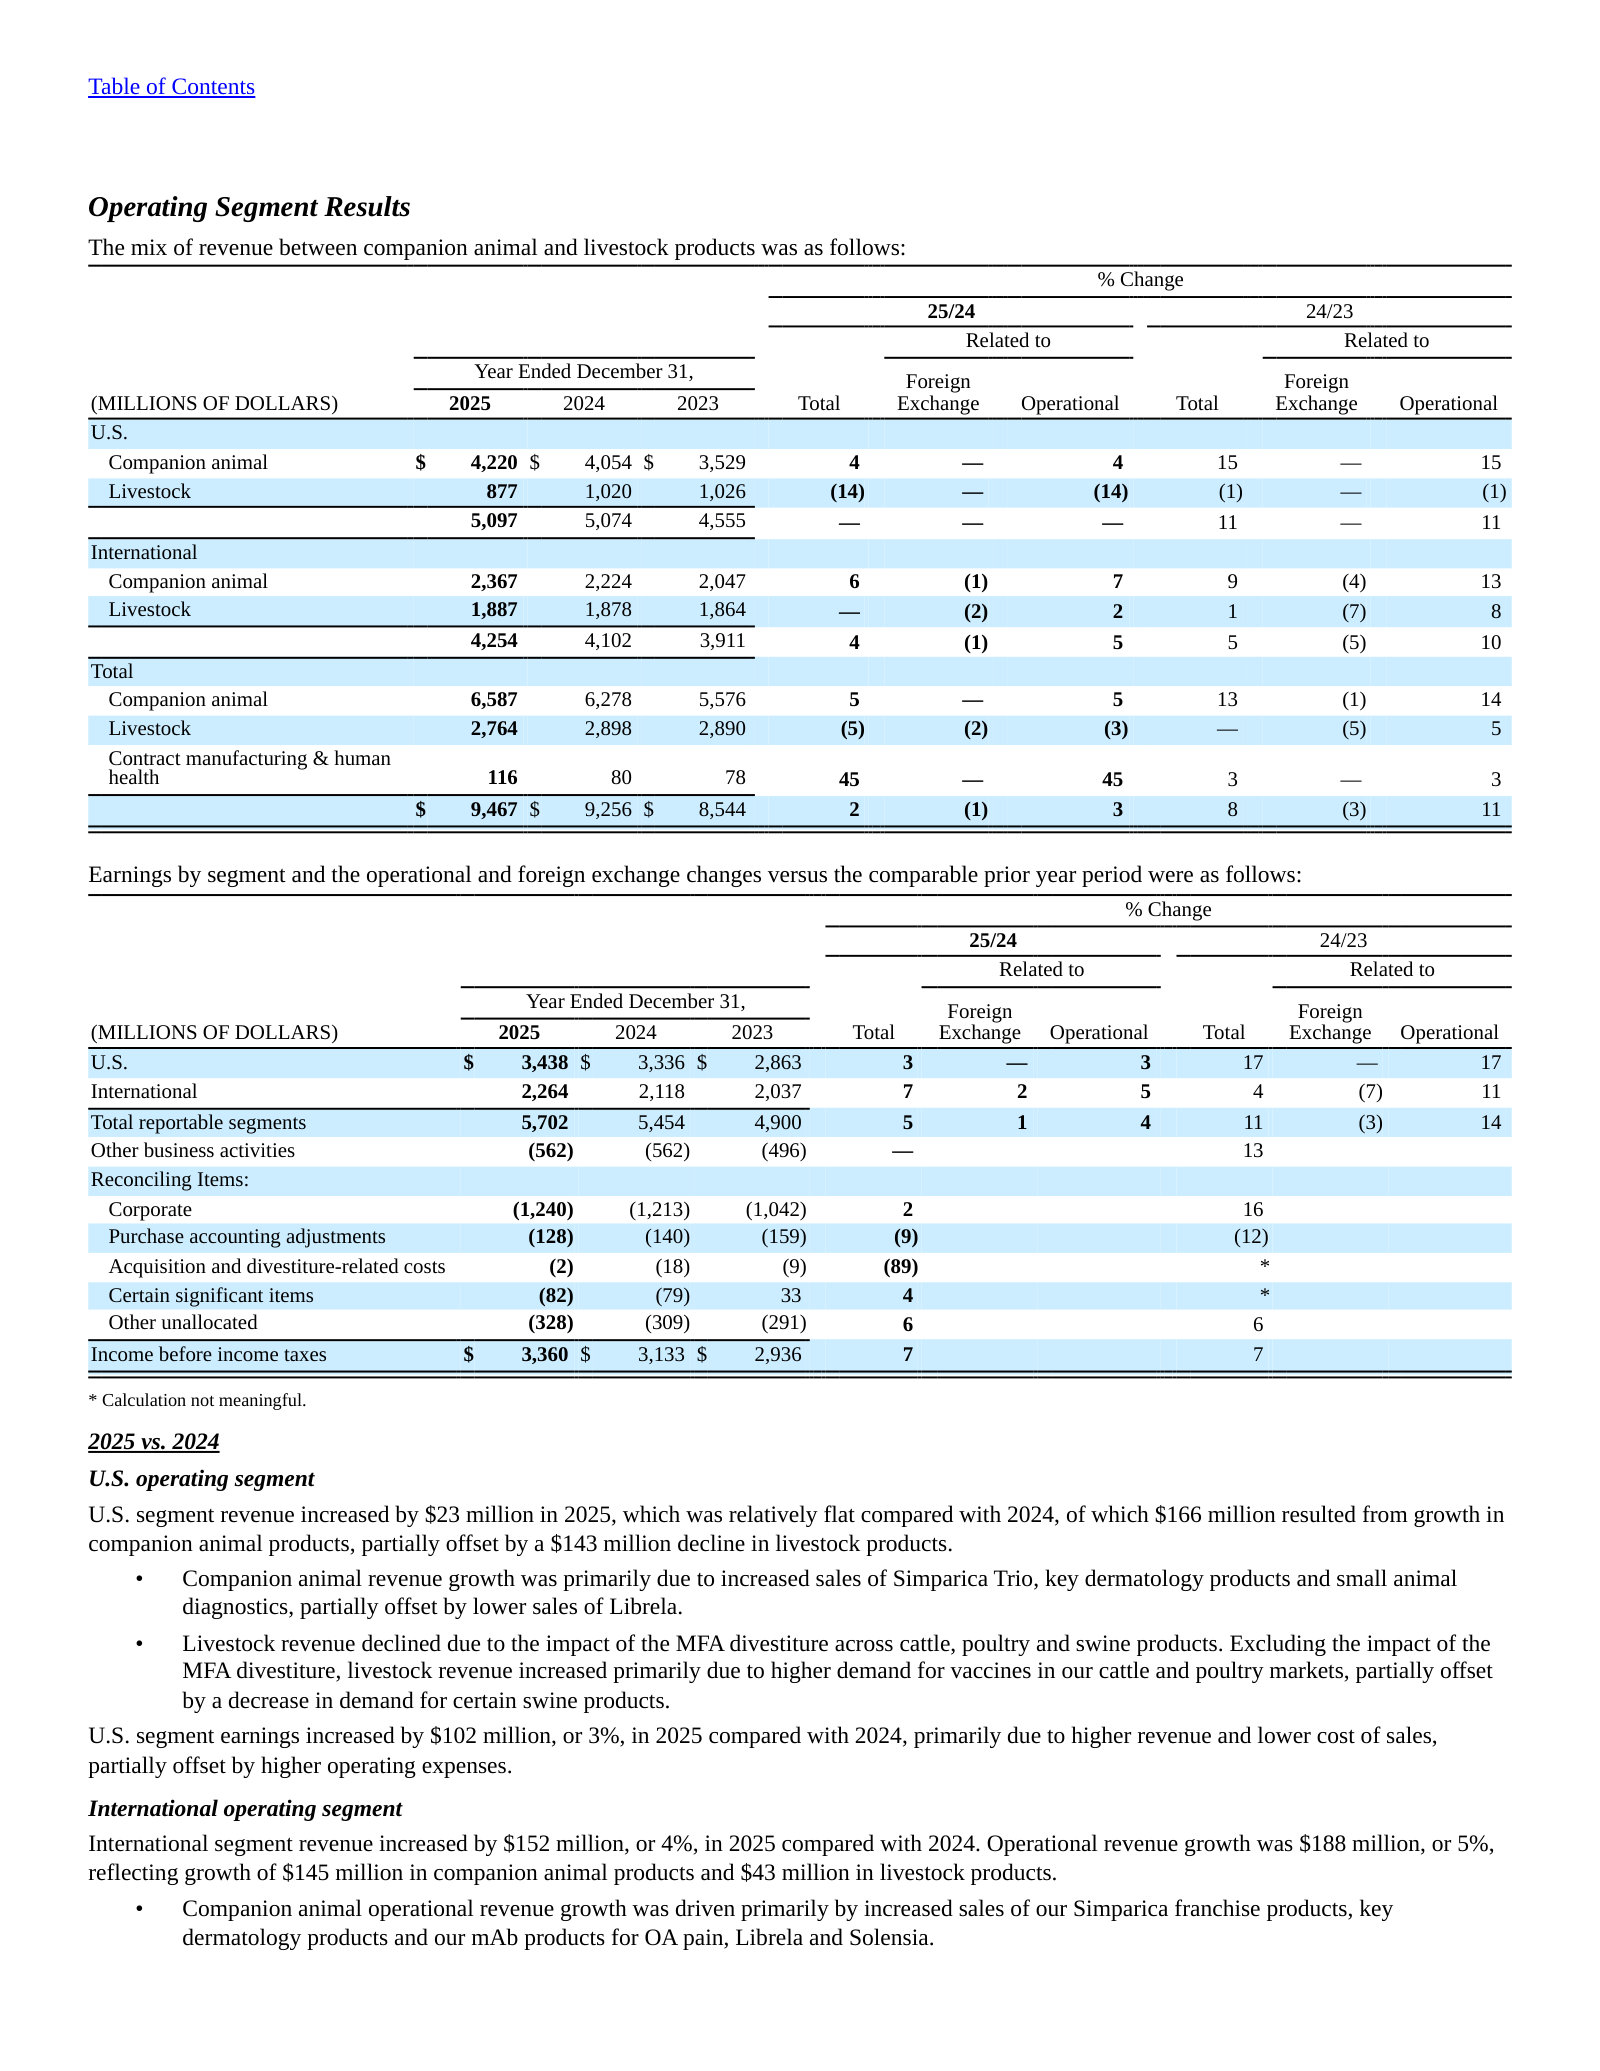
International growth driven by Simparica, dermatology and the OA-pain mAbs Librela and Solensia.
International segment revenue increased by $152 million, or 4%, in 2025 compared with 2024. Operational revenue growth was $188 million, or 5%, reflecting growth of $145 million in companion animal products and $43 million in livestock products. […] Companion animal operational revenue growth was driven primarily by increased sales of our Simparica franchise products, key dermatology products and our mAb products for OA pain, Librela and Solensia.
p. 80 · Read in context →
More annual reports
Zoetis Inc. — FY2024 Annual Report (Form 10-K) — FY2024 · 155 pages · Prior year: FY2024 revenue $9,256M (+8%); baseline for the FY2025 comparison and the MFA divestiture. · Open →
Zoetis Inc. — FY2023 Annual Report (Form 10-K) — FY2023 · 157 pages · Revenue $8,544M; the Librela U.S. launch year and strong double-digit companion-animal growth. · Open →
Zoetis Inc. — FY2022 Annual Report (Form 10-K) — FY2022 · 159 pages · Earlier edition for tracking multi-year portfolio and segment trends. · Open →
Zoetis Inc. — FY2021 Annual Report (Form 10-K) — FY2021 · 181 pages · Post-pandemic edition (revenue $7,776M); useful starting point for the five-year growth arc. · Open →
Competitors describe Zoetis Inc.'s market in their own filings and calls. These verified passages and visual pages show where their strategies meet, using source documents preserved in Sources.
Elanco Animal Health Incorporated (ELAN)
Elanco is Zoetis's most direct rival — the other large, listed pure-play animal-health company (spun out of Eli Lilly). It competes head-to-head across Zoetis's biggest companion-animal franchises (parasiticides, dermatology, pain) and across livestock, names Zoetis first among its 'primary competitors,' and its recent earnings calls quantify the specific product battles — Zenrelia against Apoquel/Cytopoint in dermatology and Credelio Quattro against Simparica Trio in parasiticides.
Elanco's FY2025 10-K lists Zoetis Inc. first among its “primary competitors” in animal-health medicines and vaccines — the two large pure-play animal-health companies naming each other as the lead rival across regions, species and product categories.
We face intense competition globally. Competition may vary depending on the particular region, species, product category or individual product. We compete principally on the basis of product quality, price, cost-effectiveness, promotional effectiveness, new product development and product differentiation. […] Our primary competitors include animal health medicines and vaccines companies such as Zoetis Inc., Boehringer Ingelheim Animal Health GmbH, the animal health division of Boehringer Ingelheim GmbH, and Merck Animal Health, the animal health division of Merck & Co., Inc. We also compete with numerous other producers of animal health products throughout the world, including start-up companies working in the animal health area.
p. 17 · Read in context →
Elanco management's account of its dermatology drug Zenrelia, which it calls the “leading dermatology market share taker” in a market it sizes at $2.1 billion, now stocked in over 16,000 U.S. clinics (>50% of the total). This is the category Zoetis leads with Apoquel and Cytopoint; the framing and figures are Elanco's own (Q1 FY2026 call).
Zenrelia reached blockbuster status on a trailing four-quarter basis with a growth trajectory well exceeding our expectations even since the late February earnings call. […] We see potential for Zenrelia to be a blockbuster in both the U.S. and international as we grow the $2.1 billion global dermatology market and continue to take share. As we enter the derm season, we see Zenrelia as the leading dermatology market share taker with demonstrated strong efficacy in the JAK1 category. […] We're now at over 16,000 U.S. vet clinics or over 50% of the total, and the reorder rate is over 80%.
p. 2 · Read in context →
Elanco's stated share gains for Credelio Quattro in what it sizes as a $1.5 billion U.S. broad-spectrum parasiticide market — 53% share within stocking clinics — describe an offensive aimed at the category where Zoetis's Simparica Trio is the incumbent leader. Claims are Elanco's, from its Q1 FY2026 call.
Quattro's market share is up 3 points since Q4 and exceeding our expectations. Most importantly, in the clinics that carry Quattro, which is now over 40% of the U.S. clinic base today, our share increased 13 points in Q1, reaching 53%. […] there remains ample room for Quattro to continue to grow and take share in the $1.5 billion U.S. broad-spectrum parasiticide market. […] Outside the U.S., Quattro has made its debut in the $750 million international market, which is growing double digits.
p. 3 · Read in context →
Merck & Co., Inc. (Merck Animal Health) (MRK)
Merck & Co. is a pharmaceutical conglomerate, but its Merck Animal Health division (MSD Animal Health outside the US) is one of the two or three largest animal-health businesses globally and a direct Zoetis rival in companion-animal parasiticides and vaccines, in livestock, and in animal identification/monitoring. Only the Animal Health portions of Merck's filings and calls are used here.
Merck Animal Health's FY2025 results: the same page's segment table shows $6.35 billion of sales (livestock ~$3.9bn, companion animal ~$2.5bn); the text quoted here reports livestock up 13% and companion animal up 2%, with the Bravecto parasiticide line at ~$1.1 billion. A scale benchmark for Zoetis's own livestock and companion-animal lines.
Sales of livestock products grew 13% in 2025 primarily due to increased demand across all species, the inclusion of sales from the July 2024 acquisition of the aqua business of Elanco Animal Health Incorporated (Elanco aqua business), improved supply, new product launches, and higher pricing. […] Sales of companion animal products grew 2% in 2025 reflecting higher pricing, new product launches, and improved supply, partially offset by lower demand for other products in the portfolio. Sales of the Bravecto line of products were $1.1 billion in 2025, an increase of 1% compared with 2024.
p. 89 · Read in context →
On its Q3 2025 call, Merck attributes a 3% decline in companion-animal sales partly to “competition in parasiticides” — the category where Merck's Bravecto and Zoetis's Simparica compete directly — alongside fewer vet visits.
Our Animal Health business again delivered strong growth, with sales increasing 7%. Livestock sales grew 14%, driven by higher demand across all species as well as a benefit from timing of sales. Companion animal sales declined 3% due to a reduction in vet visits and competition in parasiticides, partially offset by price, improved supply, and new product launches.
p. 3 · Read in context →
Merck Animal Health's own product line-up — long-acting Bravecto parasiticides, the Numelvi JAK-inhibitor for allergic dermatitis, and Nobivac vaccines — maps category-for-category onto Zoetis franchises such as Simparica, Apoquel/Cytopoint and its vaccine lines.
Bravecto, a line of oral, topical and injectable parasitic control products, including the original Bravecto (fluralaner) products for dogs and cats that last up to 12 weeks; […] Numelvi (atinvicitinib), a once daily second-generation Janus kinase inhibitor for the treatment of pruritus associated with allergic dermatitis; […] Nobivac vaccine lines for flexible dog and cat vaccination, including Nobivac NXT for canine flu and feline leukemia virus
p. 9 · Read in context →
IDEXX Laboratories, Inc. (IDXX)
IDEXX is the clear leader in companion-animal veterinary diagnostics — point-of-care analyzers and reference labs — the segment Zoetis has built out (partly through its Abaxis acquisition) and is trying to grow. IDEXX's 10-K names “Zoetis Inc. (including its wholly-owned subsidiary Abaxis, Inc.)” as a direct competitor, and its calls quantify the installed-base scale and switching costs a Zoetis challenger faces.
IDEXX's FY2025 10-K names “Zoetis Inc. (including its wholly-owned subsidiary Abaxis, Inc.)” among its direct competitors in both point-of-care and reference-lab diagnostics, in North America and internationally — placing Zoetis's diagnostics segment squarely in IDEXX's competitive set.
We compete with a number of companies in most geographic locations in North America including Mars, Incorporated brands Antech Diagnostics and Heska; and Zoetis Inc. (including its wholly-owned subsidiary Abaxis, Inc.). We also compete in certain international geographies with Zoetis Inc.; Mars, Incorporated brands including Heska, Antech Diagnostics, scil animal care, and Antech-Asia Veterinary Diagnostics; Fujifilm Holdings Corporation; Arkray, Inc.; Mindray; and BioNote, Inc.
p. 19 · Read in context →
IDEXX's framing of its market (Q3 2025 call): it calls diagnostics “the fastest-growing revenue stream within veterinary clinics” and claims “global leadership in veterinary cancer diagnostics” — the growth pool and leadership position Zoetis's diagnostics segment is competing for. “Leadership” is IDEXX's own characterization.
Diagnostics remains the fastest-growing revenue stream within veterinary clinics, a durable trend reflecting the central role testing plays in determining patient health status and guiding treatment decisions. […] We also plan to bring Cancer Dx panel to international markets starting in Q1 2026, extending its reach and accelerating our global leadership in veterinary cancer diagnostics.
p. 3 · Read in context →
Phibro Animal Health Corporation (PAHC)
Phibro is a livestock-focused animal-health company that in October 2024 acquired Zoetis's medicated-feed-additive (MFA) portfolio — so its filings and calls describe, size and report on a business Zoetis divested, and it also names Zoetis among its principal competitors. Uniquely direct 'competitor talks about the subject' material on the livestock side.
Phibro's own account of the Zoetis MFA portfolio it acquired: a ~$297.5 million purchase (completed October 2024) of a business that generated $407.6 million of revenue for Zoetis in 2023, spanning 37+ product lines in ~80 countries, and which added $208.2 million to Phibro's sales in the year ended June 30, 2025 — a direct sizing of the livestock feed-additive business Zoetis exited.
In April 2024, the Company entered into a Purchase and Sale Agreement (the “Purchase Agreement”) with Zoetis Inc., a Delaware corporation (“Zoetis”) to acquire Zoetis’s medicated feed additive (“MFA”) portfolio, certain water-soluble products and related assets (the “Acquisition”). On October 31, 2024, the Company completed the Acquisition at a purchase price of approximately $297.5 million ($286.5 million, as adjusted, net of cash acquired), subject to certain further adjustments set forth in the Purchase Agreement. […] The product portfolio acquired, which generated $407.6 million in revenue in 2023, is comprised of more than 37 product lines that are sold in approximately 80 countries. For the year ended June 30, 2025, this product portfolio contributed $208.2 million to our overall net sales.
p. 9 · Read in context →
Phibro lists Zoetis among its principal competitors in animal health and mineral nutrition — even as it now sells the MFA portfolio it bought from Zoetis — underscoring the continued livestock-segment overlap between the two.
We are engaged in highly competitive industries and, with respect to all of our major products, face competition from a substantial number of global and regional competitors. […] Some of our principal competitors include Boehringer Ingelheim International GmbH, Ceva Santé Animale, Elanco Animal Health Incorporated, Huvepharma Inc., Merck & Co., Inc. (Merck Animal Health and MSD Animal Health), Southeastern Minerals, Inc. and Zoetis. To the extent these companies or new entrants offer comparable animal health, mineral nutrition or performance products at lower prices, our business could be adversely affected.
p. 102 · Read in context →
Phibro credits the acquired “Zoetis MFA integration” with helping drive 77% growth in its MFA-and-other portfolio in Q4 FY2025 (54% for the full year) — quantifying, in the acquirer's own words, the momentum of the livestock feed-additive line Zoetis divested.
Our results this quarter reflected continued momentum across the business, led once again by Animal Health, where we saw a 53% sales growth and a 47% increase in adjusted EBITDA. Within Animal Health, our MFA and other portfolio bolstered by the Zoetis MFA integration grew 77% in the fourth quarter. […] Looking at the full year, Animal Health sales rose 36% with adjusted EBITDA up 53%. MFAs and other grew 54%, while Nutritional Specialties and Vaccines increased 9% and 13%, respectively.
p. 1 · Read in context →
Virbac (VIRP)
Virbac is an independent global pure-play animal-health company (~€1.5bn revenue) competing with Zoetis across companion-animal parasiticides, dermatology, dental and specialty nutrition, and livestock vaccines — a broad-line rival at roughly one-sixth of Zoetis's scale. Its filings are in French; key figures are rendered in the captions.
Virbac's FY2025 results as stated in its annual report: revenue of €1,465 million with +7.9% organic growth that it says ran “slightly faster than the global animal-health market,” led by companion animals (+10.9%) and North America (+14.7%). It frames itself as outgrowing the same global market Zoetis leads, with its fastest growth in the pet-health and US arenas Zoetis dominates. (Quote in French.)
Notre chifre d’afaires a atteint 1 465 millions d’euros ; à taux de change et périmètre constants, nous avons réalisé une croissance organique de 7,9%, soit une progression légèrement plus rapide que celle du marché global de la santé animale. […] Cette dynamique a été portée par une croissance de 10,9% sur notre segment des animaux de compagnie et de 6,1% sur celui des animaux d’élevage. Géographiquement, ce succès est collectif : l’Europe (+7,5%) et l’Amérique du Nord (+14,7%) ont été de puissants moteurs
p. 5 · Read in context →
Virbac's stated rationale for its 2024 Sasaeah acquisition (~€75m revenue, about half from vaccines): it claims “a leadership position in the farm animal vaccines market in Japan, notably in the cattle segment.” Livestock/cattle vaccines are a core Zoetis franchise, so this marks Virbac building regional vaccine scale in a major market where Zoetis also competes.
This strategic acquisition brings Virbac a leadership position in the farm animal vaccines market in Japan, notably in the cattle segment, and a large portfolio o pharmaceutical products for all the major species. […] Sasaeah generates annual revenues of abou €75 million, of which around 50% from vaccines.
p. 6 · Read in context →
Vetoquinol SA (VETO)
Vetoquinol is a French pure-play animal-health company (~€0.5bn revenue) that ranks itself the world's 8th-largest and competes with Zoetis in companion-animal (parasitology, dermatology, cardiology) and livestock therapeutics. Its filings offer a useful, independent sizing of the global animal-health market Zoetis leads. Filings are in French; key figures are rendered in the captions.
Vetoquinol's read of animal-health market structure: ~5% value growth in 2025 (price-driven), split roughly 55% companion / 45% livestock, with North America — chiefly the US — the single largest market at over 40% of the world and about half of the global companion-animal segment. Context for why Zoetis's US-heavy, companion-weighted revenue base sits in the richest part of the market. (Quote in French.)
En 2025, le marché mondial de la santé animale conserve une croissance positive d'environ 5 % en valeur (source : estimations Vetoquinol 2025), plus ou moins équilibrée entre le segment des animaux de compagnie (55 %) et celui des animaux d'élevage (45 %), exclusivement tirée par l'effet prix. […] L’Amérique du Nord, et plus particulièrement les États-Unis, constitue le tout premier marché de la santé animale avec plus de 40 % du marché mondial. En ce qui concerne les animaux de compagnie, le marché américain représente à lui seul environ la moitié du marché mondial de ce segment.
p. 18 · Read in context →
More peer documents
Elanco Q3 FY2025 earnings call — livestock demand & industry framing (p.9) — Q3 FY2025 · 13 pages · An analyst groups Zoetis with Elanco, Phibro and Merck as beneficiaries of unusually strong 2025 livestock demand; CEO frames farm-animal health as a low-to-mid-single-digit market still larger than pet health. · Open →
Merck Q1 FY2026 call — Animal Health division growth (p.2) — Q1 FY2026 · 12 pages · Most recent quarter for the Zoetis-competing division: Animal Health sales +6%, livestock +8%, companion animal +4% — a fresher read than the 10-K. · Open →
Phibro FY2024 10-K — pending Zoetis MFA acquisition at signing (p.48) — FY2024 · 222 pages · Describes the Zoetis MFA/water-soluble portfolio deal as pending, before completion — the terms and rationale as first disclosed. · Open →
Source: S&P Capital IQ consensus via Xpressfeed · Generated 2026-07-20.
Street snapshot
Currency: USD · Scale: money in millions, absolute (per share) · Analyst counts shown explicitly; recommendation respondents: 20.
| Street view | Reading | Analysts |
|---|---|---|
| Recommendation mix | Buy 8, Outperform 3, Hold 9, Underperform 0, Sell 0 | 20 |
| Consensus score | 2.05 | 20 |
| Target price | mean 114.8; high 160.0; low 80.00 | 17 |
Forward table
Coverage thins in the outer years, where FY2029 revenue rests on just four estimates.
Currency: USD · Scale: money in millions, absolute (per share) · Analyst count is the estimate count for each period and metric.
| Period | Metric | Mean | YoY | Analysts | Low / high |
|---|---|---|---|---|---|
| FY0E | Revenue | 9,754 | 3.0% | 18 | 9,683 / 9,932 |
| FY0E | EBITDA | 4,270 | 0.7% | 13 | 4,126 / 4,523 |
| FY0E | EBIT | 3,775 | 2.1% | — | — / — |
| FY0E | Net income (GAAP) | 2,700 | 1.0% | 5 | 2,583 / 2,751 |
| FY0E | Net income (normalized) | 2,876 | 2.2% | — | — / — |
| FY0E | EPS (GAAP) | 6.39 | 6.2% | 8 | 5.93 / 6.56 |
| FY0E | EPS (normalized) | 6.86 | 7.1% | 17 | 6.76 / 6.95 |
| FY0E | Free cash flow | 2,632 | 9.8% | — | — / — |
| FY0E | Dividend per share | 2.16 | 8.9% | — | — / — |
| FY0E | Gross margin | 71.4% | -0.4% | — | — / — |
| FY0E | Capital expenditure | -640.6 | -9.9% | — | — / — |
| FY0E | Net debt | 6,726 | 44.7% | — | — / — |
| FY0E | Cash from operations | 3,189 | 14.2% | — | — / — |
| FY0E | ROE | 75.4% | 37.3% | — | — / — |
| FY+1E | Revenue | 10,151 | 4.1% | 18 | 9,947 / 10,508 |
| FY+1E | EBITDA | 4,490 | 5.2% | 13 | 4,232 / 4,841 |
| FY+1E | EBIT | 4,009 | 6.2% | — | — / — |
| FY+1E | Net income (GAAP) | 2,935 | 8.7% | 7 | 2,706 / 3,125 |
| FY+1E | Net income (normalized) | 3,041 | 5.7% | — | — / — |
| FY+1E | EPS (GAAP) | 6.97 | 9.0% | 9 | 6.32 / 7.52 |
| FY+1E | EPS (normalized) | 7.39 | 7.7% | 19 | 7.06 / 8.03 |
| FY+1E | Free cash flow | 3,059 | 16.2% | — | — / — |
| FY+1E | Dividend per share | 2.31 | 7.1% | — | — / — |
| FY+1E | Gross margin | 71.5% | 0.0% | — | — / — |
| FY+1E | Capital expenditure | -625.5 | -2.4% | — | — / — |
| FY+1E | Net debt | 5,825 | -13.4% | — | — / — |
| FY+1E | Cash from operations | 3,417 | 7.2% | — | — / — |
| FY+1E | ROE | 65.2% | -13.5% | — | — / — |
| FY+2E | Revenue | 10,592 | 4.3% | 13 | 10,217 / 11,107 |
| FY+2E | EBITDA | 4,677 | 4.2% | 10 | 4,378 / 4,913 |
| FY+2E | EBIT | 4,213 | 5.1% | — | — / — |
| FY+2E | Net income (GAAP) | 3,057 | 4.2% | 4 | 2,937 / 3,241 |
| FY+2E | Net income (normalized) | 3,213 | 5.7% | — | — / — |
| FY+2E | EPS (GAAP) | 7.51 | 7.8% | 6 | 6.86 / 8.58 |
| FY+2E | EPS (normalized) | 7.97 | 7.9% | 13 | 7.37 / 9.12 |
| FY+2E | Free cash flow | 3,230 | 5.6% | — | — / — |
| FY+2E | Dividend per share | 2.52 | 8.9% | — | — / — |
| FY+2E | Gross margin | 71.1% | -0.5% | — | — / — |
| FY+2E | Capital expenditure | -597.4 | -4.5% | — | — / — |
| FY+2E | Net debt | 4,924 | -15.5% | — | — / — |
| FY+2E | Cash from operations | 3,565 | 4.4% | — | — / — |
| FY+2E | ROE | 54.6% | -16.3% | — | — / — |
| Q2 FY2026 | Revenue | 2,510 | 2.1% | 13 | 2,438 / 2,563 |
| Q2 FY2026 | EBITDA | 1,150 | -0.3% | 5 | 1,091 / 1,186 |
| Q2 FY2026 | EBIT | 1,025 | 7.2% | — | — / — |
| Q2 FY2026 | Net income (GAAP) | 751.3 | 4.6% | 3 | 738.0 / 758.0 |
| Q2 FY2026 | Net income (normalized) | 783.3 | 8.5% | — | — / — |
| Q2 FY2026 | EPS (GAAP) | 1.76 | 9.5% | 4 | 1.68 / 1.82 |
| Q2 FY2026 | EPS (normalized) | 1.85 | 5.3% | 14 | 1.77 / 1.90 |
| Q2 FY2026 | Free cash flow | 684.0 | — | — | — / — |
| Q2 FY2026 | Dividend per share | 0.53 | 6.0% | — | — / — |
| Q2 FY2026 | Gross margin | 72.7% | 1.1% | — | — / — |
| Q2 FY2026 | Capital expenditure | -168.1 | -12.0% | — | — / — |
| Q2 FY2026 | Net debt | 7,004 | 42.0% | — | — / — |
| Q2 FY2026 | Cash from operations | 1,086 | — | — | — / — |
| Q2 FY2026 | ROE | 81.5% | 43.1% | — | — / — |
| Q3 FY2026 | Revenue | 2,505 | 4.4% | 11 | 2,476 / 2,549 |
| Q3 FY2026 | EBITDA | 1,138 | 3.5% | 4 | 1,106 / 1,167 |
| Q3 FY2026 | EBIT | 1,008 | 6.1% | — | — / — |
| Q3 FY2026 | Net income (GAAP) | 725.9 | 0.7% | 2 | 725.7 / 726.0 |
| Q3 FY2026 | Net income (normalized) | 771.7 | 6.7% | — | — / — |
| Q3 FY2026 | EPS (GAAP) | 1.74 | 6.6% | 4 | 1.68 / 1.81 |
| Q3 FY2026 | EPS (normalized) | 1.85 | 8.7% | 13 | 1.79 / 1.90 |
| Q3 FY2026 | Dividend per share | 0.53 | 6.0% | — | — / — |
| Q3 FY2026 | Gross margin | 71.6% | 0.1% | — | — / — |
| Q3 FY2026 | Capital expenditure | -163.5 | -13.4% | — | — / — |
| Q3 FY2026 | Net debt | 7,015 | 46.4% | — | — / — |
| Q3 FY2026 | ROE | 74.4% | 35.6% | — | — / — |
| Q3 FY2026 | Cash from operations | 818.0 | — | — | — / — |
| Q4 FY2026 | Revenue | 2,464 | 3.2% | 11 | 2,376 / 2,542 |
| Q4 FY2026 | EBITDA | 1,025 | 4.4% | 4 | 992.6 / 1,063 |
| Q4 FY2026 | EBIT | 919.1 | 11.3% | — | — / — |
| Q4 FY2026 | Net income (GAAP) | 635.0 | 5.3% | 2 | 622.0 / 648.0 |
| Q4 FY2026 | Net income (normalized) | 672.9 | 8.7% | — | — / — |
| Q4 FY2026 | EPS (GAAP) | 1.50 | 9.7% | 4 | 1.44 / 1.55 |
| Q4 FY2026 | EPS (normalized) | 1.63 | 10.0% | 13 | 1.52 / 1.69 |
| Q4 FY2026 | Dividend per share | 0.53 | 6.0% | — | — / — |
| Q4 FY2026 | Gross margin | 70.2% | 0.8% | — | — / — |
| Q4 FY2026 | Capital expenditure | -160.8 | -9.1% | — | — / — |
| Q4 FY2026 | Net debt | 6,505 | 69.0% | — | — / — |
| Q4 FY2026 | Cash from operations | 851.0 | — | — | — / — |
| Q4 FY2026 | ROE | 73.0% | 53.9% | — | — / — |
| Q1 FY2027 | Revenue | 2,367 | 4.7% | 6 | 2,293 / 2,430 |
| Q1 FY2027 | EBITDA | 1,014 | 4.0% | 1 | 1,014 / 1,014 |
| Q1 FY2027 | EBIT | 899.7 | -1.9% | — | — / — |
| Q1 FY2027 | Net income (GAAP) | 647.5 | 7.7% | 2 | 612.0 / 683.0 |
| Q1 FY2027 | Net income (normalized) | 684.1 | -1.2% | — | — / — |
| Q1 FY2027 | EPS (GAAP) | 1.51 | 6.6% | 3 | 1.46 / 1.61 |
| Q1 FY2027 | EPS (normalized) | 1.64 | 7.2% | 8 | 1.57 / 1.69 |
| Q1 FY2027 | Dividend per share | 0.61 | 13.5% | — | — / — |
| Q1 FY2027 | Gross margin | 71.5% | -0.5% | — | — / — |
| Q1 FY2027 | Capital expenditure | -156.8 | -2.0% | — | — / — |
| Q1 FY2027 | Net debt | 6,355 | 11.8% | — | — / — |
| Q1 FY2027 | ROE | 75.1% | -1.0% | — | — / — |
Estimate momentum
Currency: USD · Scale: money in millions, absolute (per share) · Point-in-time consensus; analyst count is shown where supplied.
| Period | Metric | Lookback | Then | Now | Direction / magnitude | Analysts |
|---|---|---|---|---|---|---|
| 2028 | Revenue | 30d | 10,652 | 10,592 | down 0.6% | — |
| 2028 | Revenue | 90d | 10,917 | 10,592 | down 3.0% | — |
| 2028 | Revenue | 180d | 10,909 | 10,592 | down 2.9% | — |
| 2027 | EPS (normalized) | 30d | 7.42 | 7.39 | down 0.4% | — |
| 2027 | EPS (normalized) | 90d | 7.57 | 7.39 | down 2.4% | — |
| 2027 | EPS (normalized) | 180d | 7.41 | 7.39 | down 0.3% | — |
| 2027 | Revenue | 30d | 10,182 | 10,151 | down 0.3% | — |
| 2027 | Revenue | 90d | 10,390 | 10,151 | down 2.3% | — |
| 2027 | Revenue | 180d | 10,471 | 10,151 | down 3.1% | — |
| 2028 | EPS (normalized) | 30d | 8.02 | 7.97 | down 0.6% | — |
| 2028 | EPS (normalized) | 90d | 8.22 | 7.97 | down 3.0% | — |
| 2028 | EPS (normalized) | 180d | 7.97 | 7.97 | down 0.0% | — |
Beat / miss record
Over the last eight quarters normalized EPS beat consensus seven times, with surprises ranging from +2.84% to +9.15%, before missing by 5.28% in Q1 2026. Revenue surprises were smaller and mixed — mostly low-single-digit beats — and also slipped to -1.70% in that quarter.
Current sequences by metric: Revenue: 1 consecutive miss; EPS (normalized): 1 consecutive miss.
Currency: USD · Scale: money in millions, absolute (per share) · Consensus is captured before each actual first became effective; analyst count shown per observation.
| Quarter | Metric | Consensus as of | Actual | Surprise | Outcome | Analysts |
|---|---|---|---|---|---|---|
| Q1 FY2026 | Revenue | 2,301 | 2,262 | -1.7% | Miss | — |
| Q1 FY2026 | EPS (normalized) | 1.62 | 1.53 | -5.3% | Miss | — |
| Q4 FY2025 | Revenue | 2,362 | 2,387 | 1.1% | Beat | — |
| Q4 FY2025 | EPS (normalized) | 1.40 | 1.48 | 5.5% | Beat | — |
| Q3 FY2025 | Revenue | 2,405 | 2,400 | -0.2% | Miss | — |
| Q3 FY2025 | EPS (normalized) | 1.62 | 1.70 | 4.8% | Beat | — |
| Q2 FY2025 | Revenue | 2,408 | 2,460 | 2.2% | Beat | — |
| Q2 FY2025 | EPS (normalized) | 1.61 | 1.76 | 9.2% | Beat | — |
| Q1 FY2025 | Revenue | 2,193 | 2,220 | 1.2% | Beat | — |
| Q1 FY2025 | EPS (normalized) | 1.40 | 1.48 | 5.8% | Beat | — |
| Q4 FY2024 | Revenue | 2,299 | 2,317 | 0.8% | Beat | — |
| Q4 FY2024 | EPS (normalized) | 1.36 | 1.40 | 2.8% | Beat | — |
| Q3 FY2024 | Revenue | 2,293 | 2,388 | 4.2% | Beat | — |
| Q3 FY2024 | EPS (normalized) | 1.46 | 1.58 | 8.0% | Beat | — |
| Q2 FY2024 | Revenue | 2,310 | 2,361 | 2.2% | Beat | — |
| Q2 FY2024 | EPS (normalized) | 1.48 | 1.56 | 5.3% | Beat | — |
Where the street disagrees
The signal weakens further out, where FY2029 rests on as few as two GAAP estimates.
Currency: USD · Scale: money in millions, absolute (per share) · Dispersion is high-low divided by absolute mean; analyst count shown per item.
| Period | Metric | Mean | Low | High | Spread / mean | Analysts |
|---|---|---|---|---|---|---|
| 2028 | EPS (GAAP) | 7.51 | 6.86 | 8.58 | 22.9% | 6 |
| Q4 FY2024 | EPS (GAAP) | 1.24 | 1.12 | 1.40 | 22.6% | 7 |
| 2028 | EPS (normalized) | 7.97 | 7.37 | 9.12 | 21.9% | 13 |
| 2027 | EPS (GAAP) | 6.97 | 6.32 | 7.52 | 17.2% | 9 |
| Q1 FY2025 | EPS (GAAP) | 1.33 | 1.24 | 1.44 | 15.1% | 7 |
Source: Visible Alpha consensus via S&P Xpressfeed · Consensus as of 2026-07-15 · generated 2026-07-20.
Model trust
This is a deep, timely consensus rather than a thin or stale one.
Base currency: USD · VA scales normalized from Abs, M; item currencies and units retained · Coverage depth and vintage; broker count is the maximum represented.
| Brokers | Line items | Last revision |
|---|---|---|
| 13 | 537 | 2026-07-15 |
Operating KPIs
Base currency: USD · VA scales normalized from Abs, M; item currencies and units retained · FY-1A / FY0E / FY+1E; broker count shown per KPI.
| Operating KPI | Source | FY-1A | FY0E | FY+1E | Brokers |
|---|---|---|---|---|---|
| Companion animal - YoY growth(%) | CD | 5.3% | 1.6% | 4.1% | 13 |
| Contract manufacturing & human health | CD | 107,996.85bn Amount | 112,488.82bn Amount | 116,397.98bn Amount | 13 |
| Cost of sales - operating | CD | 2,668,178.87bn Amount | 2,767,306.78bn Amount | 2,869,954.01bn Amount | 13 |
| Income tax expense/(benefits) - operating | CD | 719,041.77bn Amount | 741,348.06bn Amount | 778,072.18bn Amount | 13 |
| Interest income/(expense) - operating | CD | -183,998.37bn Amount | -202,324.14bn Amount | -209,127.68bn Amount | 13 |
| Livestock | CD | 2,725,819.75bn Amount | 2,951,588.21bn Amount | 3,058,744.96bn Amount | 13 |
| Livestock - YoY growth(%) | CD | -5.9% | 8.0% | 3.6% | 13 |
| Amortization of intangible assets - operating | CD | 20,788.99bn Amount | 18,131.56bn Amount | 22,768.27bn Amount | 12 |
| Companion animal | CD | 6,611,907.33bn Amount | 6,671,153.91bn Amount | 6,946,724.56bn Amount | 12 |
| Companion animal - International | CD | 2,367,700.28bn Amount | 2,561,690.21bn Amount | 2,698,203.96bn Amount | 11 |
| Companion animal - US | CD | 4,241,105.20bn Amount | 4,108,771.72bn Amount | 4,235,834.60bn Amount | 11 |
| Contract manufacturing & human health - YoY growth(%) | CD | 34.9% | -3.7% | 3.3% | 11 |
P&L bridge
Base currency: USD · VA scales normalized from Abs, M; item currencies and units retained · Margins are derived against revenue; YoY compares adjacent fiscal columns; broker count shown per line.
| P&L line | FY-1A | FY0E | FY+1E | Brokers |
|---|---|---|---|---|
| Revenue | 9,445,708.94bn Amount | 9,735,230.93bn Amount (3.1% YoY) | 10,121,867.50bn Amount (4.0% YoY) | 13 |
| Gross Profit | 6,777,739.09bn Amount (71.8% margin) | 6,967,924.16bn Amount (71.6% margin; 2.8% YoY) | 7,251,913.49bn Amount (71.6% margin; 4.1% YoY) | 13 |
| Ebitda | 3,997,187.45bn Amount (42.3% margin) | 4,324,594.96bn Amount (44.4% margin; 8.2% YoY) | 4,519,539.86bn Amount (44.7% margin; 4.5% YoY) | 11 |
| Operating Income | 3,719,271.31bn Amount (39.4% margin) | 3,822,536.94bn Amount (39.3% margin; 2.8% YoY) | 4,000,793.86bn Amount (39.5% margin; 4.7% YoY) | 13 |
| Net Income | 2,818,513.62bn Amount (29.8% margin) | 2,882,780.85bn Amount (29.6% margin; 2.3% YoY) | 3,016,504.24bn Amount (29.8% margin; 4.6% YoY) | 13 |
| Eps | 6.34 Amount | 6.88 Amount (8.6% YoY) | 7.33 Amount (6.5% YoY) | 13 |
Consensus dispersion
Trio) spans roughly $1.6B to $2.0B, signaling an unsettled debate on the US companion-animal growth trajectory. The widest percentage spread is in the small contract manufacturing & human health line, where the dollar stakes are minor.
Base currency: USD · VA scales normalized from Abs, M; item currencies and units retained · Top high-low spreads relative to absolute mean; requires at least 3 brokers.
| Line item | Period | Mean | Min | Q1 | Q3 | Max | Spread / mean | Brokers |
|---|---|---|---|---|---|---|---|---|
| Contract manufacturing & human health - YoY growth(%) | 2QFY-2026 | 2.4% | -17.0% | 0.2% | 4.9% | 20.0% | 1555.3% | 10 |
| Companion animal - YoY growth(%) | 2QFY-2026 | -0.5% | -4.6% | -1.3% | 0.2% | 3.0% | 1425.6% | 12 |
| Contract manufacturing & human health - YoY growth(%) | 1QFY-2026 | 2.5% | -13.8% | 0.0% | 5.0% | 20.0% | 1375.6% | 11 |
| Contract manufacturing & human health - YoY growth(%) | FY-2026 | -3.7% | -9.8% | -6.0% | -2.4% | 9.5% | 522.8% | 11 |
| Livestock - YoY growth(%) | 4QFY-2025 | -1.4% | -5.4% | -2.7% | 0.2% | 1.0% | 471.4% | 11 |
| Contract manufacturing & human health - YoY growth(%) | 3QFY-2026 | 4.3% | 0.0% | 1.2% | 4.8% | 20.0% | 467.0% | 10 |
Quarterly path
Base currency: USD · VA scales normalized from Abs, M; item currencies and units retained · Next four supplied quarters; final column is maximum broker coverage in the row.
| Quarter | Companion animal - YoY growth(%) | Contract manufacturing & human health | Cost of sales - operating | Income tax expense/(benefits) - operating | Interest income/(expense) - operating | Total revenue | EPS Diluted, Applicable to common stockholders($) | Broker coverage |
|---|---|---|---|---|---|---|---|---|
| 3QFY-2026 | 3.1% | 23,781.01bn Amount | 712,999.64bn Amount | 197,684.05bn Amount | -53,812.78bn Amount | 2,502,429.87bn Amount | 1.86 Amount | 12 |
| 4QFY-2026 | 4.8% | 31,026.01bn Amount | 736,214.01bn Amount | 173,596.65bn Amount | -52,669.35bn Amount | 2,461,635.22bn Amount | 1.63 Amount | 12 |
| 1QFY-2027 | 4.4% | 23,651.86bn Amount | 661,524.72bn Amount | 174,757.02bn Amount | -54,757.58bn Amount | 2,348,038.42bn Amount | 1.62 Amount | 8 |
| 2QFY-2027 | 4.4% | 35,162.09bn Amount | 700,177.19bn Amount | 211,510.70bn Amount | -52,927.24bn Amount | 2,595,734.38bn Amount | 1.97 Amount | 8 |
80 stale period values omitted; 9 line items fully removed.
Source: S&P Capital IQ transcripts via Xpressfeed · latest indexed call 2026-05-07 · generated 2026-07-20.
Latest call digest
Zoetis Inc., Q1 2026 Earnings Call, May 07, 2026 · 2026-05-07T12:30:00
Q1 2026 (reported May 7, 2026) was the sharpest negative inflection in this call history. Management opened by conceding the quarter "unfolded differently than expected, particularly in companion animal." Organic operational revenue was flat and adjusted net income grew 1%, but the gap between the prepared remarks and the Q&A reality was wide: a fiscal-year-alignment change shifted roughly $100 million of international sales from Q4 2025 into the quarter, and excluding it revenue would have declined about 5%.
Beneath the headline, U.S. revenue fell 8% and U.S. companion animal fell 11%, with key dermatology down 11% and Librela down 13%. Management tied this to a convergence of vet-clinic price increases and lower traffic, pet-owner price sensitivity, and intensified competition that — unlike prior cycles — did not expand the market. International (+10%) and livestock (+12%) again cushioned the result.
The actually-stated guidance was cut: full-year organic operational revenue to 2%–5% (from the 3%–5% set in February) and adjusted net income to 2%–6%. Management launched a comprehensive cost and productivity program, lowered its aggregate price assumption to 1%–2%, and announced an agreement to acquire Neogen's animal genomics business. The Q&A was dominated by doubt that a roughly flat Q1 can bridge to the full-year guide, and by whether the market itself has structurally weakened.
Participant coverage from the latest call.
| Group | Participants | Count |
|---|---|---|
| Management | Operator; Steven Frank — Vice President of Investor Relations, Zoetis Inc.; Kristin Peck — CEO & Director, Zoetis Inc.; Wetteny Joseph — Executive VP & CFO, Zoetis Inc. | 4 |
| Analysts | Michael Ryskin — MD & Research Analyst, BofA Securities, Research Division; Erin Wilson Wright — Equity Analyst, Morgan Stanley, Research Division; Brandon Vazquez — Analyst, William Blair & Company L.L.C., Research Division; Christopher Schott — Senior Analyst, JPMorgan Chase & Co, Research Division; Jonathan Block — MD & Senior Equity Research Analyst, Stifel, Nicolaus & Company, Incorporated, Research Division; Steven Dechert — Associate, KeyBanc Capital Markets Inc., Research Division; Navann Ty Dietschi — Pharmaceuticals and Medtech Analyst, BNP Paribas, Research Division; Daniel Christopher Clark — Research Analyst, Leerink Partners LLC, Research Division; Andrea Zayco Narvaez Alfonso — Healthcare Analyst, UBS Investment Bank, Research Division; Christopher LoBianco — Research Associate, TD Cowen, Research Division | 10 |
Curated latest-call exchanges; one row per analyst topic.
| Analyst | Firm | Topic | What changed in Q&A |
|---|---|---|---|
| Michael Ryskin | BofA Securities | Near-term levers vs. multi-year competition; the guidance bridge | Pushed that the biggest pipeline launches are years out and competition is still early, then asked management to reconcile a roughly flat Q1 with the full-year guide, calling the implied ramp aggressive. Management pointed to share stabilization in paras and Librela and easier second-half comps. |
| Erin Wright | Morgan Stanley | Implied companion-animal ramp, channel destock, script denials | Probed whether the guide bakes in a distributor/retail restock. Management said it is not assuming inventory returns and is operating at the low end of a post-2023 range. |
| Brandon Vazquez | William Blair | Whether animal health has structurally become less durable | Framed price sensitivity, no market expansion and generics as a 'new world.' Peck rejected that reading, citing the human-animal bond, urgent-care and diagnostics strength, and no expected generics in key categories. |
| Christopher Schott | JPMorgan | Pricing reaction to competitor promotions; U.S. companion trajectory | Management said it will not lead on price, will use selective actions and promotions, and expects key franchises to grow low-to-mid single digits — a step down from the initial guide. |
| Jonathan Block | Stifel | Quantifying the channel hit; whether Zoetis is pivoting to a cheaper option | Asked to size the U.S. Pet Health channel impact; management did not quantify it and attributed it to soft demand. Peck clarified list prices are not being cut — the focus is point-of-sale affordability and loyalty programs. |
| Navann Ty Dietschi | BNP Paribas | Pricing strategy in derm and for upcoming renal/oncology/cardiology launches | Management set aggregate price expectation at 1%–2% (down from 2%–3%) and said a competitor raised JAK prices, narrowing but not closing the gap to Zoetis. |
| Andrea Zayco Narvaez Alfonso | UBS | Gross-margin trajectory and whether Neogen is in the guide | Q1 gross margin was 71.8% (up ~140 bps ex-FX); management said the 2%–5% range could accommodate a Neogen close in the second half. |
Theme tracker
Themes are curator-classified across supplied calls.
| Theme | Status | Quarters mentioned | Read-through |
|---|---|---|---|
| U.S. clinic softness and pet-owner price sensitivity | persisted | Q1 2025, Q2 2025, Q3 2025, Q4 2025, Q1 2026 | Began as overall-visit softness that management said was offset by therapeutic strength and alternative channels. By Q3 2025 through Q1 2026 therapeutic visits themselves fell and multi-year vet-clinic price increases were cited as the cause, making this the primary drag rather than a manageable headwind. |
| Key dermatology competition (oral JAK/IL-31 entrants) | persisted | Q4 2024, Q1 2025, Q2 2025, Q3 2025, Q4 2025, Q1 2026 | For over a year framed as manageable via first-mover advantage and market expansion, with only 'limited' share loss. In Q1 2026 key derm fell 11% as price sensitivity and competition combined without market growth to cushion the effect. |
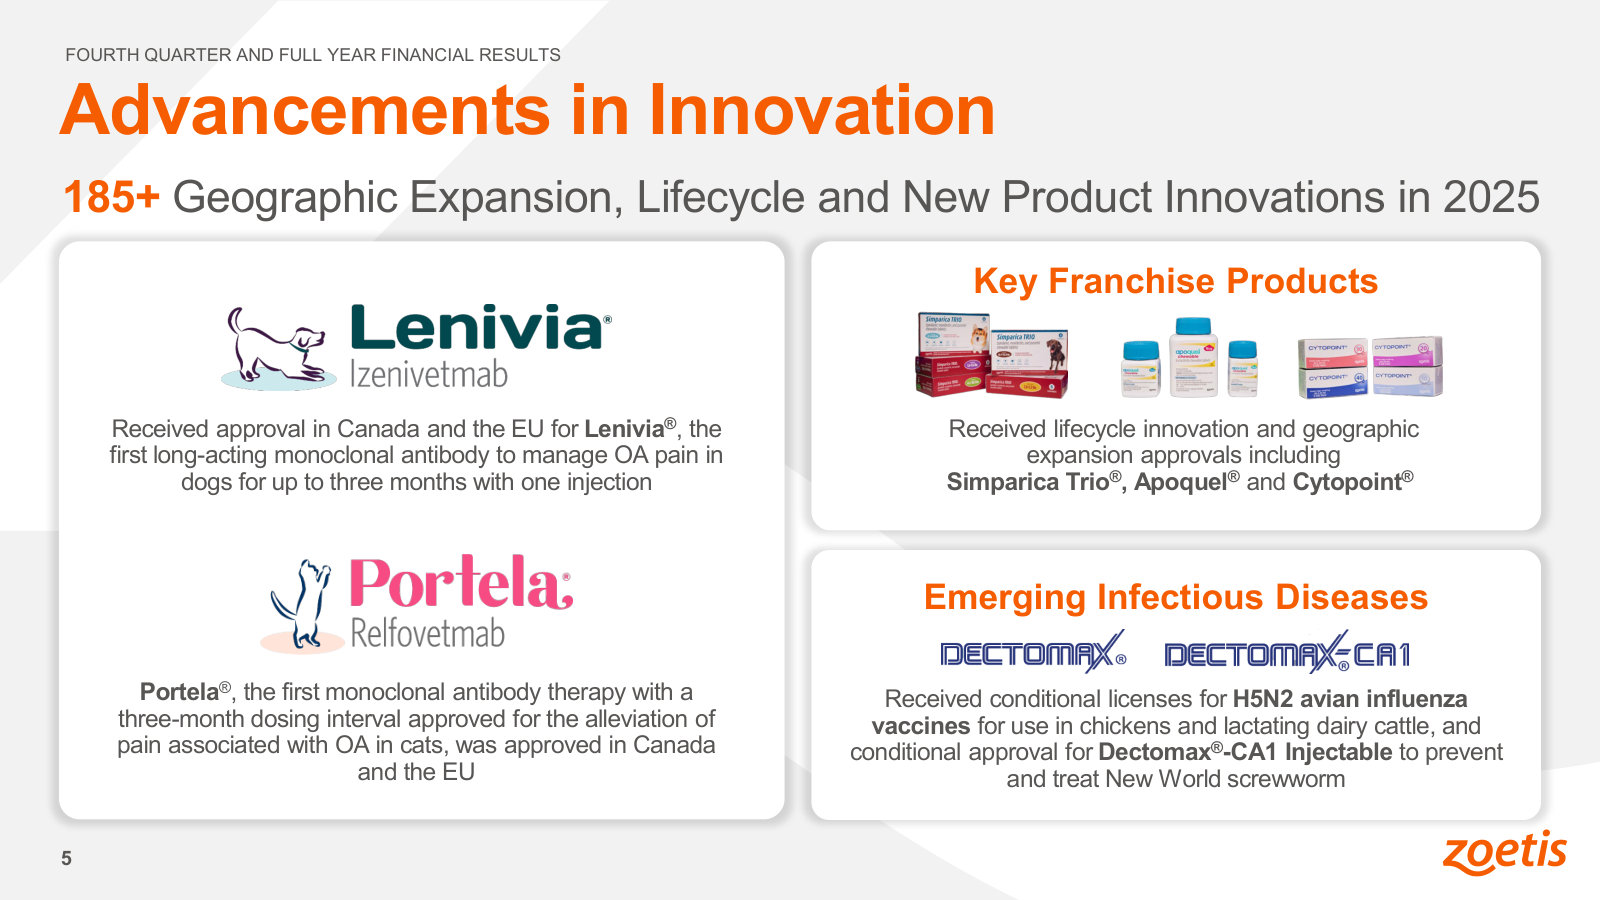
| Librela / OA pain recovery | persisted | Q1 2025, Q2 2025, Q3 2025, Q4 2025, Q1 2026 | From a fast 2024 blockbuster launch to 2025 declines blamed on social-media/safety perception, met with a multi-pronged education and Phase IV strategy. By Q1 2026 U.S. Librela rose sequentially for the first time in six quarters, with long-acting Lenivia launching in the EU and Canada. |
| Livestock as the diversification ballast | persisted | Q1 2025, Q2 2025, Q3 2025, Q4 2025, Q1 2026 | Consistent above-market growth (a third consecutive year in 2025, then 12% in Q1 2026) that repeatedly offset companion-animal weakness, aided by the MFA divestiture and rising protein demand. |
| Alternative and retail channel growth | persisted | Q1 2025, Q2 2025, Q3 2025, Q4 2025, Q1 2026 | Retail and home delivery grew roughly 25%–30% through 2024–2025 and cushioned clinic softness, but slowed to about 10% in Q1 2026 partly on retail script denials — removing a key offset just as clinic demand weakened. |
| Fiscal-year alignment / accounting recast | emerged | Q4 2025, Q1 2026 | Introduced in Q4 2025, the calendar alignment shifted about $100 million of international sales into Q1 2026 and complicated comparability. Management said it was expected to add 200–250 bps to full-year 2026 growth, but the weak environment more than offset that. |
| Tariff exposure | dropped | Q1 2025, Q2 2025 | A central topic in early 2025 (with a stated ~$20 million net headwind embedded and extensive Section 232 lobbying) that has since faded from active discussion, superseded by macro, competition and the fiscal-year-alignment mechanics. |
Guidance ledger
Quotes, calls, and speakers are source-verified; outcomes are curator-classified.
| Verbatim guidance | Call | Speaker | Curator outcome | Outcome note |
|---|---|---|---|---|
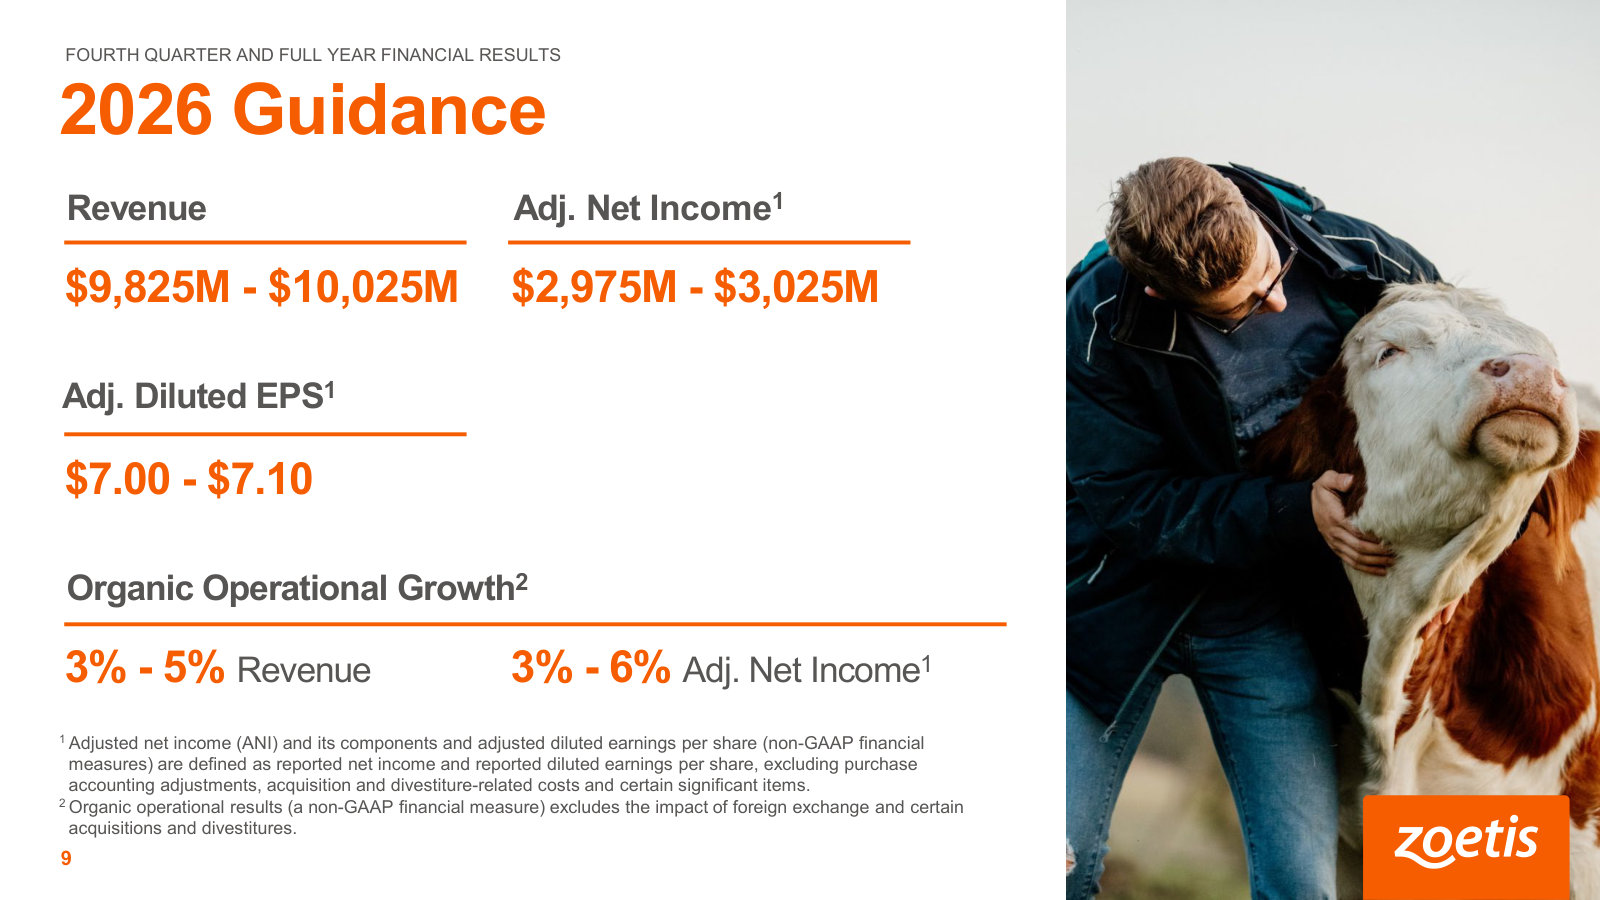
| “Looking ahead to 2026, we are guiding to a range of 3% to 5% organic operational revenue growth and expect 3% to 6% organic operational growth in adjusted net income.” | Zoetis Inc., Q4 2025 Earnings Call, Feb 12, 2026 · 2026-02-12T13:30:00 | Kristin Peck | missed | One quarter later, on the Q1 2026 call, the floor of both ranges was cut, to 2%–5% revenue and 2%–6% adjusted net income. |
| “we would return to our normal rate range, which is 2% to 3%, which is what you can assume in this guidance” | Zoetis Inc., Q4 2025 Earnings Call, Feb 12, 2026 · 2026-02-12T13:30:00 | Wetteny Joseph | missed | By Q1 2026 the aggregate price expectation had been lowered to a 1% to 2% range, per management on that call. |
| “We are revising our full year revenue guidance to a range of $9.4 billion and $9.475 billion and organic operational growth of 5.5% to 6.5% based on a more measured view of macro and operational trends in the back half of the year.” | Zoetis Inc., Q3 2025 Earnings Call, Nov 04, 2025 · 2025-11-04T13:30:00 | Wetteny Joseph | kept | Full-year 2025 landed at 6% organic operational revenue growth per the Q4 2025 call, within this range. |
| “we are raising our full year guidance for organic operational revenue growth to 6.5% to 8%.” | Zoetis Inc., Q2 2025 Earnings Call, Aug 05, 2025 · 2025-08-05T12:30:00 | Kristin Peck | missed | This raised range was cut to 5.5%–6.5% the next quarter, and full-year 2025 finished at 6%, below the 6.5% floor set here. |
| “We are maintaining our full year organic operational revenue guidance range of 6% to 8%” | Zoetis Inc., Q1 2025 Earnings Call, May 06, 2025 · 2025-05-06T12:30:00 | Kristin Peck | kept | Full-year 2025 delivered 6% organic operational revenue growth, at the low end of this range. |
Q&A pressure map
Question counts and firms are curator tallies; analyst coverage shown above.
| Topic | Questions | Firms | Pressure / response |
|---|---|---|---|
| Credibility of the full-year ramp after a flat Q1 | 3 | BofA Securities, Morgan Stanley, JPMorgan | Analysts repeatedly asked management to bridge a roughly flat Q1 to the 2%–5% full-year guide, questioning the implied second-half acceleration. Management leaned on easier back-half comps, franchise stabilization and cost actions rather than a demand rebound. |
| Pricing strategy amid competitor promotions | 4 | JPMorgan, Stifel, KeyBanc, BNP Paribas | Several analysts pressed whether Zoetis would cut list price or defend on promotions. Management held that it will not lead on price and disclosed its aggregate price assumption had dropped to 1%–2%. |
| Competitive intensity in dermatology and parasiticides | 3 | BofA Securities, William Blair, BNP Paribas | Questions focused on whether new entrants are lasting rather than launch-phase, and whether competition is now on efficacy as well as price. Management said promotions are lasting longer than historically but still expects them to stabilize. |
| Distributor and retail destocking / script denials | 2 | Morgan Stanley, Stifel | Analysts asked management to isolate and quantify the channel headwind on U.S. companion animal. Management said the channel had normalized but did not provide the specific dollar impact requested, attributing the effect back to soft end-market demand. |
Language shifts
Only language evidence verified against the referenced component is shown.
| Observation | Verbatim evidence | Call ID | Component |
|---|---|---|---|
| Management opened the latest call by conceding the quarter missed plan — a departure from prior confident openings that led with strong broad-based growth. | “the quarter unfolded differently than expected, particularly in companion animal” | 1993042978 | 2 |
| The CFO stated results were below plan outright, language not used in the prior several quarters. | “performance that is below our expectations this quarter” | 1993042978 | 3 |
| A new cost-discipline vocabulary entered the narrative, signaling a shift from an investment-led posture to defensive cost action. | “launched a comprehensive cost and productivity program” | 1993042978 | 2 |
| For contrast, three quarters earlier the tone emphasized broad-based strength, underscoring how far the register shifted by Q1 2026. | “we delivered strong broad-based 8% organic operational revenue growth” | 1951458863 | 2 |
The call history traces a clean inflection: three years of resilient, above-market growth giving way through 2025 and into Q1 2026 to slowing companion-animal demand, price-driven competition and a string of guidance cuts. The open question for investors is whether this is cyclical pressure that stabilizes, as management argues, or a more durable reset to bridge before the 2027–2028 pipeline arrives.
Zoetis, and a Halved Share Price
Zoetis is the world's largest animal health company: a patent-protected, high-return franchise that turned about 28 cents of every revenue dollar into profit in 2025 and earned a 78% return on equity. Yet its shares have fallen roughly 69% from their 2021 peak to about $76, most of that in the last year, after U.S. companion-animal demand softened and management cut its outlook twice. This report exists to weigh whether that de-rating has gone too far, or not far enough.
What Zoetis is
Zoetis discovers, develops, manufactures and sells medicines, vaccines, diagnostics and genetic tests for animals. It works across eight core species — dogs, cats and horses on the companion-animal side; cattle, swine, poultry, fish and sheep on the livestock side — and seven product categories including parasiticides, vaccines, dermatology and pain treatments [1]. The company was carved out of Pfizer, incorporated in Delaware in 2012 and taken public in a 2013 IPO [2]. It has no founder and no controlling shareholder; the register is institutional.
The revenue mix has tilted steadily toward pets. Companion-animal products made up about 70% of 2025 revenue, with livestock most of the balance and a small contract-manufacturing and human-health diagnostics line [3]. That tilt is the growth story and, lately, the problem: companion animal has been the engine, and it is where demand has cooled.
Source: derived from reported segment revenue, FY2022–FY2025 [4].
Revenue is concentrated in a handful of brands. In 2025 the parasiticide line Simparica and Simparica Trio contributed about 16% of revenue, and the dermatology drug Apoquel about 12%; the top five products and lines — adding the dermatology antibody Cytopoint, the osteoarthritis-pain antibody Librela and the ceftiofur anti-infective line — reached roughly 42%, and the top ten about 57% [5]. A concentrated, patented portfolio is the source of the margins — and the reason a competitive or safety problem in any one franchise carries weight.
The economics that earned a premium
The business is unusually profitable. On $9.47 billion of 2025 revenue Zoetis earned $2.67 billion of net income and $6.03 in basic EPS [6]. Net margin was about 28%, return on equity about 78%, and the company converted revenue to roughly $2.3 billion of free cash flow.
Revenue FY2025 ($B)
Net Income FY2025 ($B)
Free Cash Flow FY2025 ($B)
Net Margin
Return on Equity
Trailing P/E
Source: FY2025 reported results [7]; free cash flow and returns derived from reported financials; P/E at a share price near $76.
Those returns rest on scale and patents. Zoetis is the largest company in animal health by revenue and competes with Boehringer Ingelheim, Merck Animal Health, Elanco and, in diagnostics, IDEXX [8]. It also carries the standing risk of any drug business: when patents lapse, generics take share. The company's own filing shows how sharply — U.S. sales of its older Rimadyl and Draxxin products fell 39% and 66% respectively after generic entry [9].
Revenue and earnings compounded steadily through 2024. The break came in 2025.
Source: reported results, FY2019–FY2025 [10].
Growth stalled first
Reported revenue growth slowed to about 2% in 2025 from 8% in 2024. The first quarter of 2026 confirmed the deceleration was demand-led, not currency: organic operational revenue was flat, U.S. revenue fell 8%, and companion-animal revenue declined 4% [11].
Source: derived from reported revenue, FY2020–FY2025 [12]. Growth here is reported and includes currency and acquisitions; the company guides on organic operational growth.
Management named four converging pressures in the first quarter: rising vet-clinic prices against lower clinic traffic; pet owners growing more price-sensitive toward premium preventative and chronic-care products, where Zoetis is over-indexed; intensified competition in dermatology, parasiticides and vaccines, with more entrants pricing aggressively; and, unusually, those entrants taking share without expanding the overall market [13]. A separate overhang sits on the osteoarthritis-pain antibody Librela, which the FDA flagged for adverse-event reports in dogs in late 2024; international Librela sales fell 7% in the first quarter of 2026 [14].
The company cut its full-year 2026 outlook to organic operational revenue growth of 2% to 5% and adjusted net income growth of 2% to 6%, and launched a cost-and-productivity program [15]. For a business the market had valued as a high-single-digit-to-low-teens grower, a 2%-to-5% year is a sharp step down from the growth that had been priced in.
Zoetis still grows and still earns high returns, but the growth rate has stepped down: FY2025 revenue rose about 2%, Q1 FY2026 organic revenue was flat, and FY2026 guidance is 2% to 5% organic — the question is whether that is a trough or a new baseline.
The de-rating
The share price tells the story more starkly than the fundamentals. Zoetis peaked near $247 at the end of 2021 and traded around $76 in mid-July 2026 — a fall of roughly 69%, with the sharpest leg in the twelve months to mid-2026 as the guidance cuts landed.
Source: company share-price history, year-end closes 2013–2025 and mid-July 2026, as reported.
The de-rating is a multiple story, not an earnings collapse. Earnings are near record levels, yet the stock trades at about 12.6 times trailing EPS and roughly 11 times the consensus 2026 estimate of about $6.86 — well below the low-to-mid-30s multiples Zoetis carried for most of its public life. In multiple terms, that is a compression to roughly a third of its former level, on earnings that are near record highs.
Sell-side opinion has softened but not capitulated: the consensus price target sits near $115, with a low estimate of about $80 still above the current price, and the ratings split roughly 11 buy to 9 hold with no sells. The market is pricing a serious slowdown, not a broken business.
Source: consensus analyst estimates and price targets, as of mid-2026.
Capital allocation reflects management's own read that the shares are cheap. Under a $6 billion program authorized in 2024, Zoetis repurchased 23.9 million shares for $3.2 billion in 2025, leaving $2.4 billion of authorization [16]; it also pays a $0.50 quarterly dividend [17]. Much of that 2025 buyback was executed at prices well above today's, a tension a later chapter on capital allocation should weigh.
The question this report answers
Zoetis presents the classic fallen-quality setup: a durable, high-return, patent-protected leader in a structurally growing market — pet ownership and pet-care spending — whose shares have halved as growth decelerated and competition and demand pressures converged. The central question every chapter that follows connects to is this: is the de-rating in Zoetis pricing a temporary demand-and-competition air pocket in a business that resumes high-single-digit growth and high returns, or the early evidence that its growth algorithm — premium pricing, patent-protected franchises, expanding companion-animal demand — is structurally slowing? The answer turns on the durability of the moat, the depth and duration of the U.S. demand and competitive pressure, the credibility of the pipeline management points to for 2027–2028, and the margin of safety in a low-double-digit multiple on still-growing earnings.
Franchise Moat
Zoetis earns unusually durable economics — a 71.8% gross margin that has widened for a decade — because animal health has never grown a large generic industry the way human pharma did. That structural gap is real and shows up in the numbers. But the moat is franchise-specific and patent-bounded: older products have already lost most of their sales to generics, the top five brands make ~42% of revenue, and the 2026 evidence shows branded rivals now taking share out of Zoetis directly, because the market has stopped expanding to absorb them.
Why animal health resists generics
The foundation of Zoetis's economics is a fact about its industry, not about the company: there is no scaled generic threat. In its own words, "there is no large, well-capitalized company focused on generic animal health products that exists as a global competitor in the industry" [1]. Zoetis attributes this to three features of the market: each product opportunity is relatively small, distribution and education run directly through veterinarians, and the customer largely self-pays with no insurer pushing substitution [2].
That last point matters most. In human pharma, a patent expiry hands a formulary and a reimbursement system a reason to switch millions of scripts overnight. In a vet clinic, the prescriber and the dispenser are the same person, the brand is chosen at the point of care, and the pet owner pays cash. A generic still has to be detailed to the vet one clinic at a time. The result is that patent cliffs erode slowly, not abruptly — a real advantage, but one that slows the pace of erosion rather than preventing it.
The moat in the margin
A claimed moat has to appear in returns or pricing, or it is not established. Zoetis's does. Gross margin has climbed from 65.9% in 2016 to 71.8% in 2025 — a decade of widening despite acquisitions, currency, and a rising cost base.
Source: derived from reported revenue and cost of sales, FY2016–FY2025 10-Ks; recent gross margin confirmed in MD&A, where cost of sales fell to 28.2% of revenue in 2025 [3].
The mechanism behind the margin is pricing power, and management quantifies it. In the second quarter of 2024, stripping out hyperinflationary Argentina, Zoetis was adding "roughly 6 points of price and 3 points of volume" to revenue [4] — in that quarter, most of its growth came from charging more, not selling more units. By late 2024 it described growing "volume double digits while simultaneously taking price by being more targeted in our promotions" [5]. A business that raises price and holds share is exercising a moat; a commodity cannot.
Gross Margin (FY2025)
Top-5 Brands, % of Revenue
Draxxin US Sales Decline
Sources: gross margin per FY2025 MD&A [6]; top-five concentration [7]; Draxxin decline [8].
Franchise Concentration and Prior Erosion
The pricing power is not spread evenly. Two brands — Simparica and Apoquel — made roughly 16% and 12% of 2025 revenue; the top five (adding Cytopoint, Librela, and the ceftiofur line) reached about 42%, and the top ten about 57% [9]. The moat is really a handful of franchise moats, each with its own patent clock.
What happens when a clock runs out is on the record. Once generic tulathromycin arrived, US sales of the cattle antibiotic Draxxin fell 66%; the arthritis NSAID Rimadyl's US chewable sales fell 39% after generics launched [10]. The active-ingredient patents for Draxxin, the Excede/Naxcel ceftiofur line, and the anti-nausea drug Cerenia have all expired, with generics already on sale in multiple markets [11]. One of these — the ceftiofur line — sits inside the top-five revenue concentration cited above. Erosion is not a hypothetical for Zoetis; it is a repeating feature of the older book.
The offset has been a cadence of innovation that keeps replacing expiring exclusivity with newer, differentiated franchises. Cytopoint was the first canine monoclonal antibody for atopic dermatitis; Simparica Trio took Zoetis from fifth to second in triple-combination parasiticides; Librela created the injectable osteoarthritis-pain category and reached an 85% penetration rate faster than any product in company history [12]. Management's stated defense against new competitors is differentiation: "As we've seen with past generations of parasiticides, new entrants tend to accelerate the transition from older therapies. However, without meaningful differentiation, they do not take away market share" [13]. That claim is the moat's load-bearing assumption — and 2026 is testing it.
The test: share loss without market growth
In the first quarter of 2026 the franchises that carry the moat turned negative at the same time. Global companion-animal revenue fell 4%; key dermatology fell 11%, the osteoarthritis-pain antibodies fell 8%, and the Simparica line fell 1% — while companion diagnostics grew 10% and livestock grew 12% [14].
Source: Q1 FY2026 earnings call — global franchise revenue [15].
The important detail is not that competition arrived — Apoquel and Simparica have faced branded rivals for years — but how it is landing. Management named four dynamics: rising clinic prices with lower traffic, more price-sensitive pet owners, more aggressive competitor pricing across more markets, and, in contrast to prior cycles, new entrants that "have not yet translated into overall market expansion" [16]. That fourth point bears most directly on the moat. In every earlier parasiticide and dermatology cycle, a new competitor grew the category and Zoetis kept its slice of a bigger pie. In 2026 the pie stopped growing, so a rival's gain comes directly out of Zoetis's revenue. On the dermatology franchise, price "has played a larger role in the decision process," with share loss "amplified by a derm market with declining patient volume" [17].
The pricing lever is narrowing as a result. Zoetis entered 2026 planning 2–3% aggregate price and cut that expectation to 1–2%, conceding that the price gap to lower-cost competitors "is closing" [18]. Two of the four demand dynamics are macro (traffic, price sensitivity) and plausibly cyclical; the other two (more entrants, no market expansion) speak to the moat itself.
What the evidence supports
The moat is real and, by a decade of widening margins and demonstrated pricing power, has been wide. Two facts keep it from being impregnable: it is patent-bounded on a franchise-by-franchise basis — as the Draxxin and ceftiofur histories show — and its width now depends on continuous innovation rather than on structural protection from generics. The strongest fact for durability is that today's pressure is still branded competition, not generics: management states it is "not expecting generics in any of our key categories" — naming dermatology, pain, and parasiticides specifically — in the near term, even as generics have begun to bite the older Cerenia and Convenia brands [19]. Branded rivals must still earn each clinic; a moat that widened for ten years does not vanish in two quarters.
The strongest fact against is the one management itself flagged: for the first time, new entrants are taking share without expanding the market [20]. If that persists, the "differentiation defends share" assumption weakens, and the pricing power visible in the margin trend compresses. The read that would change here is a measurable one: whether Simparica and key-dermatology share stabilize as the companion-animal market returns to volume growth, or whether share keeps leaking in a flat market. Zoetis reports both, quarter by quarter, and the franchise concentration behind the de-rating means those two lines carry most of the answer.
Demand Diagnosis
Independent practice-transaction data shows US veterinary clinic visits falling for four straight years, yet Zoetis grew its US companion-animal business through that decline by expanding therapeutic categories and lifting spend per visit. In the first quarter of 2026 that offset broke: visits fell across every major therapeutic area at the same moment competition and pet-owner price sensitivity peaked, and US companion revenue dropped 11%. The evidence leans structural, with a real transient overlay; the direction of therapeutic-visit volume through 2026 is what separates the two.
The decoupling that carried US growth
For most of the last decade Zoetis's US story ran on a quiet decoupling: clinic foot traffic was soft, but the company's revenue climbed anyway. The mechanism had two parts. Pet owners who did visit spent more — in the first quarter of 2024, total vet clinic visits fell 1.5% while revenue and spend per visit rose 4.5% and 6% [1]. And the therapeutic visits that matter most to Zoetis grew even as wellness visits shrank: in the fourth quarter of 2024 dermatology visits rose 4% and pain-related visits rose 15%, so clinic revenue grew 7% on a per-visit basis "despite declining visits overall," and US companion-animal revenue grew 7% [2].
New product cycles did the rest of the work. Simparica Trio grew 61% in the US in the first quarter of 2024, and dermatology grew 27%, each expanding its category faster than clinic traffic contracted [3]. This is the innovation-led growth mechanism the moat produced (Franchise Moat): innovation created new demand faster than a maturing clinic channel eroded it.
Sources: Q1 2024 transcript [4]; Q4 2024 transcript [5]; Q3 2025 transcript [6]; Q1 2026 transcript [7].
Where the mechanism broke
The offset held until the therapeutic-visit growth that powered it reversed. In the third quarter of 2025, management noted declining visits "across all major therapeutic areas," which cut into new patient starts, and US companion-animal revenue went flat [8]. By the first quarter of 2026 the reversal was full: US companion-animal revenue fell 11%, with dermatology down 13%, the Simparica franchise down 8%, and osteoarthritis-pain antibodies down 15% [9].
US companion animal
US dermatology
US Simparica
US OA-pain mAbs
Q1 2026 US revenue, year-over-year. Source: Q1 2026 transcript [10].
What made the quarter different from prior competitive cycles was that the categories themselves stopped growing. Management put it plainly: "Unlike prior competitive cycles, we do not currently have the benefit of underlying market expansion to cushion the revenue effect of competitive share shifts," with dermatology facing "a derm market with declining patient volume in the clinic" and parasiticides showing "market contraction with softness in the clinics driven by lower flea tick and heartworm visits" [11]. For the first time, competitors' share gains came directly out of Zoetis's revenue rather than out of a bigger pie — and generics reached two companion-animal blockbusters, Convenia and Cerenia, that had not faced them before [12]. Management's own summary was that growth "is less driven by new product cycles" as it bridges to the next innovation wave [13].
Cyclical or structural
Part of the first-quarter collapse is genuinely transient. Winter storms cut clinic visits, distributor and retail partners drew down inventory instead of replenishing, and a fiscal-year alignment shifted roughly $100 million of international sales out of the prior quarter — without which the global organic decline would have been 5% rather than a headline distorted by timing [14], [15]. Comparisons ease as the year progresses, and management reports early stabilization: US Librela revenue rose sequentially for the first time in six quarters [16]. Management also frames the demand as delayed rather than lost, pointing to an estimated 11 million US dogs untreated or undertreated for itch alone [17].
The structural signal is harder to wave off, and it is not Zoetis's own number. Independent transaction data from Vetsource, covering roughly 6,500 US practices, shows US veterinary visits declining every year — down 3.5% in 2022, 1.4% in 2023, 2.6% in 2024, and 3.1% in 2025 — with the discretionary wellness end of the visit spectrum falling fastest. The interval between client visits stretched by nearly half between 2020-21 and 2023-24. And the price sensitivity Zoetis cites is deepening across the industry: a 2025 Gallup and PetSmart Charities study found 52% of US pet owners had skipped or declined veterinary care, most citing cost, and an AVMA-referenced survey found 81% of veterinarians reporting clients more cost-sensitive than a year earlier. This is a multi-year, market-wide erosion of clinic traffic that predates Zoetis's 2026 stumble.
US veterinary visit volume, year-over-year change; independent practice-transaction data (Vetsource white papers, April 2025 and January 2026). Not a Zoetis disclosure.
Zoetis's earlier framing shows how much the ground has moved. In 2022, a 4% visit decline was dismissed as a hard comparison against "unprecedented levels," with the industry judged "structurally and fundamentally in good shape" [18]; in early 2023 US clinic visits were still rising 2% [19]. What was cyclical noise then has settled into a persistent downtrend.
A useful control sits inside Zoetis's own results. In international markets where the standard of care is still maturing, that mechanism still works: international companion-animal revenue grew 7% in the first quarter of 2026, and the international Simparica franchise grew 14%, precisely because those categories are still expanding [20]. The engine is not broken; the US categories it feeds on have matured. The broader demand drivers management leans on — rising pet ownership, longer-lived pets, a deepening human-animal bond — remain intact in the filings [21], but they describe a slower, more contested US market than the one that produced the last decade of double-digit growth.
The read
The weight of evidence points to a structural shift in the US companion-animal market rather than a single-quarter air pocket. That decoupling worked because innovation expanded categories faster than clinic traffic fell; in 2026 that offset ran out just as competition intensified and macro caution deepened, and the market-wide visit data says the traffic erosion is secular, not seasonal. That said, this is a matter of degree, not a broken franchise: the same engine still compounds internationally, the untreated-patient runway is real, and a meaningful slice of the first quarter was storms, destocking, and calendar timing that will not repeat. The strongest fact against the structural read is that early stabilization is already visible and comparisons ease through 2026.
What would decide it is category volume, not share. If therapeutic-visit growth in dermatology and pain returns to positive as comparisons ease in the back half of 2026, the cyclical case holds and the offset resumes. Another year of declining category volumes — with share losses landing on a shrinking base — would confirm that the US growth algorithm has structurally slowed, and would put more weight on the 2027-2028 innovation wave management is pointing to, a pipeline it describes as 12 potential blockbusters, to re-expand categories that are no longer growing on their own [22].
Cash Conversion
Zoetis converts reported profit into cash at a high, durable rate. Over the past decade operating cash flow ran about 1.12 times net income, and free cash flow absorbed roughly 86 cents of every dollar of profit after funding a capacity build-out. The conversion is genuine — the earnings lean on little stock compensation and little intangible amortization — but lumpy, swinging with a large and growing inventory book. Free cash flow was $2.28 billion in 2025 [1].
For an investor who has watched the multiple fall by two-thirds, this chapter tests whether the ~28% net margin is spendable cash or accounting profit. It weighs the income statement against the cash-flow statement and finds the profit is largely real cash — the source of downside protection even if growth stays slow — with two honest qualifications: the conversion is uneven year to year, and in 2025 the company distributed more than it earned in cash by leaning on new debt.
Free Cash Flow FY2025 ($M)
FCF Margin FY2025
Operating Cash Flow / Net Income FY2025
FCF / Net Income, 10-yr cumulative
Source: derived from the Consolidated Statements of Cash Flows and Statements of Income, FY2016–FY2025 10-Ks [2].
The decade record
The clean way to judge earnings quality is to place three lines side by side: net income, the operating cash flow it generated, and the free cash flow left after capital spending. When operating cash flow tracks or exceeds net income year after year, the profit is cash-backed rather than an accrual.
Source: Consolidated Statements of Cash Flows and Statements of Income, FY2016–FY2025 10-Ks; FY2025 figures [3].
Operating cash flow has exceeded net income in eight of the last ten years, and cumulatively over the decade it ran to about $20.1 billion against $17.9 billion of reported net income — a conversion of roughly 1.12 times [4]. Free cash flow — after the capacity investment discussed below — cumulated to about $15.3 billion, or 86 cents per dollar of reported profit. In 2025 specifically, operating cash flow of $2,904 million covered net income of $2,673 million 1.09 times, and free cash flow reached $2,283 million after $621 million of capital expenditure [5].
Source: derived from Consolidated Statements of Cash Flows and Statements of Income, FY2016–FY2025 10-Ks [6].
The free-cash-flow line is the noisier of the two, dipping to 0.63 times net income in 2022 and 0.69 times in 2023 before recovering above 0.85 times. That dispersion is the real texture of this business: the profit becomes cash reliably, but the timing of when it becomes cash depends on the inventory and capital cycles below.
Why the profit is cash
Two features separate Zoetis from the many pharmaceutical companies whose reported earnings need heavy adjustment before they resemble cash. First, the non-cash charges that flatter cash flow at acquisitive drugmakers are small here. Depreciation and amortization was $487 million in 2025, of which amortization of acquired intangibles was only $128 million — about 1.4% of revenue [7]. Share-based compensation was $83 million, roughly 3% of net income [8]. A business that generates cash flow by adding back large intangible amortization and paying employees in stock is converting less than it appears; Zoetis does little of either.
Second, the gap between statutory and management-preferred earnings is narrow. Adjusted net income — the company's non-GAAP figure, which strips purchase-accounting and acquisition items — was $2,847 million in 2025 against reported net income of $2,673 million, a difference of about 6.5% [9]. The same gap was 8.3% in 2024 and 4.8% in 2023 [10]. A single-digit adjustment is unusual in this sector, where "adjusted" earnings routinely run tens of percent above the audited number. Here, the audited number and management's number are close, and both are close to cash.
Source: FY2025 10-K — performance summary [11] and Consolidated Statements of Cash Flows [12].
Where the lumpiness comes from
The conversion is real; the timing is not smooth. Two lines explain almost all of the year-to-year swing.
The first is capital spending. Capital expenditure climbed from about 6% of revenue in 2021 to a peak of 8.6% in 2023 — $732 million — as Zoetis expanded manufacturing, then eased back to $621 million, or 6.6% of revenue, in 2025 [13]. Capital expenditure has run above depreciation for years — $621 million against $487 million of D&A in 2025 — which means reported free cash flow is struck after growth investment, not merely maintenance. As the build-out normalizes, the capex-to-D&A gap should narrow and free cash flow should track closer to operating cash flow.
The second, larger swing factor is inventory. Zoetis carried $2,464 million of inventory at the end of 2025, up from $1,923 million in 2021 — roughly 337 days of cost of sales, and rising [14]. Management attributes the build to production "for the forecasted demand of certain products" [15]. Inventory alone consumed $199 million of cash in 2025 and $361 million in 2023; combined with a $236 million receivables build, working capital was the main reason operating cash flow slipped slightly year on year even as net income rose [16].
Source: Consolidated Balance Sheets, FY2021–FY2025 10-Ks; days derived from reported cost of sales [17].
What a slowdown does to the cash
The demand softness examined in Demand Diagnosis makes the inventory book cut both ways, and the direction matters for a margin-of-safety reader.
On the downside, a large stock of product built for "forecasted demand" that has since weakened is exposed to write-downs. Zoetis already runs a recurring inventory-provision charge — $68 million in 2025, $97 million in 2024 and $115 million in 2023 — so obsolescence is a live cost, not a hypothetical [18]. A sharper demand shortfall would raise it.
On the other side, working capital is a cash reservoir in a downturn. If Zoetis stops building inventory and lets 337 days of stock run down, the unwind releases cash into operating cash flow — the mechanical counterpart of the distributor and retail destocking that pressured Q1 2026 revenue. In other words, the same slowdown that dents the income statement tends to support the cash-flow statement for a period. This is why high-margin, self-funding businesses often show their steadiest free cash flow precisely when growth disappoints, and it is the core of the downside protection here: the business threw off $2.28 billion of free cash flow in a year its US companion-animal engine stalled.
Interest is the one structural drag that only moves one way. Net interest expense was $222 million in 2025, little changed from $225 million in 2024 despite a step-up in gross debt, because the newly issued convertible carries a low coupon [19]. Against operating income of roughly $3.6 billion, interest is covered about 16 times, and net debt sits near 1.6 times EBITDA — comfortably inside the range that would trouble the reader's never-touch-bankruptcy line [20]. The solvency question is addressed in full elsewhere; for cash conversion, the point is narrow — rising debt trims free cash flow at the margin but does not threaten its generation.
The 2025 caveat
Strong conversion is not the same as living within cash flow. In 2025 Zoetis returned $3,235 million to shareholders through buybacks and $889 million in dividends — $4.12 billion against $2.28 billion of free cash flow, or about 1.8 times what the business generated [21]. The gap was bridged with debt: $2,000 million of convertible notes and $1,848 million of senior notes, against $1,350 million of repayments [22]. That is a capital-allocation choice, not a cash-conversion flaw, and it belongs to the governance and balance-sheet question the report takes up next. Noted here only so the free-cash-flow strength is not mistaken for self-restraint: the cash is real, but in 2025 the company chose to distribute more than it made.
The read
On the evidence, cash conversion is a genuine strength and a source of downside protection in the case. A decade of operating cash flow above net income, a single-digit non-GAAP gap, minimal stock compensation and light intangible amortization all point the same way: the reported ~28% net margin is spendable cash, and the business self-funds through a demand slowdown.
The strongest fact against reading this as pristine is the inventory book — $2.46 billion and 337 days, built for a demand forecast that has since softened, carrying a live write-down cost. It makes free cash flow lumpy and exposes it to obsolescence if the slowdown deepens. What would change the read: a sustained rise in the inventory-provision charge, or receivables and inventory growing faster than sales for several quarters, would signal the conversion is decaying rather than merely cycling. Through 2025, the evidence runs the other way — the cash keeps arriving.
Capital Allocation
Zoetis returned $4.1 billion to shareholders in 2025 — about 1.8 times free cash flow — funding the gap with a new $2.0 billion convertible and $1.85 billion of senior notes. The buyback has shrunk the share count roughly 9% since 2022, but at average prices of $136 to $178, well above the ~$76 the stock reached in 2026. Directors and officers own under 1% of the company; there is no founder. Governance screens clean, and three directors bought at the lows.
A capital-return surge that outran cash
Zoetis is a distributor of its own cash. It carries no acquisition ambition large enough to absorb the roughly $2.3 billion of free cash flow the business throws off, so almost all of it goes back to shareholders through buybacks and a growing dividend (Cash Conversion). In most years that return has run close to, or just above, free cash flow. In 2025 it broke away from it.
Buyback and dividend cash from the FY2025 cash flow statement; free cash flow derived as operating cash flow less capital expenditure [1].
Total returns rose from about $1.78 billion in 2023 (1.10x free cash flow) to $2.64 billion in 2024 (1.15x) to $4.12 billion in 2025 — 1.81 times the $2.28 billion of free cash flow the company generated that year [1]. The company covered the shortfall by raising debt: it issued $2.0 billion of convertible notes and $1.85 billion of senior notes during the year, against $1.35 billion repaid, and long-term debt rose from $5.22 billion to $9.04 billion [1][2]. This is the year management chose to lean into the buyback as the stock fell, rather than let repurchases float with cash generation.
The buyback's price problem
The instinct — buy more as the price drops — is the right one. The execution has been costly. Zoetis has repurchased shares every year, and the pace accelerated: 6.3 million shares for $1.10 billion in 2023, 10.5 million for $1.87 billion in 2024, and 23.9 million for $3.25 billion in 2025 [3]. But the average price paid in each of those years sits above where the stock later traded.
Average price derived from treasury shares acquired and cash paid, FY2025 10-K equity statement; recent price is the July 2026 market level [3].
The 2023 and 2024 tranches averaged roughly $175 and $178 a share; the 2025 tranche, bought into the decline, averaged about $136 [3]. All three are well above the ~$76 at which the shares traded in mid-2026 after the guidance cut (The De-Rating). Judged against the price today, more than $6 billion of buybacks over three years bought shares the market now values at roughly half. That is the plain counter to any claim of counter-cyclical discipline: management bought steadily on the way down, not at the bottom.
The offsetting facts are real and worth stating. The repurchases did reduce shares outstanding from about 464 million at the end of 2022 to 425 million at the end of 2025 — a ~9% cut that lifts per-share earnings and concentrates each holder's claim [2]. Diluted earnings per share reached $6.02 in 2025, and the dividend has risen every year, from $1.56 per share declared in 2023 to $2.03 in 2025 [4]. What would change the read on the buyback is time: if the business reaccelerates and the shares recover, the 2025 purchases look astute; if the de-rating proves structural, they will read as debt raised to support a falling stock.
The convertible and the capped call
The instrument that funded the 2025 acceleration deserves its own look, because it is where financial engineering meets the buyback. In December 2025 Zoetis issued $2.0 billion of convertible senior notes due 2029 at a coupon of just 0.250%, with an initial conversion price of about $148.20 per share [5]. Of the $1.97 billion of net proceeds, $248 million bought back 2.1 million shares concurrently — implying a share price near $118 at issuance — and a further $1.54 billion funded additional repurchases, substantially completed by year-end [5].
The mechanics favour shareholders in two ways. The 0.250% coupon is close to free money — about $5 million of annual interest on $2.0 billion — so the trade swaps expensive equity for very cheap debt. And Zoetis spent $187 million on capped call transactions that lift the effective conversion price the company would bear from $148.20 to $211.72, covering roughly 13.5 million shares, so dilution is neutralised unless the stock nearly triples from today [5]. Bondholders, in exchange for the low coupon, hold a call struck at $148.20 — nearly double the mid-2026 price — so conversion only becomes a live question if the shares recover substantially.
The judgment is mixed rather than damning. The structure is a sophisticated, low-cost way to retire equity, and the capped call genuinely limits future dilution. But it added $2.0 billion of permanent-feeling debt to accelerate a buyback whose timing has, so far, been poor — and the $187 million spent on the capped call is a real cash cost paid to protect against a dilution scenario that requires the stock to almost triple. A company this cash-generative did not need to borrow to return capital; it chose to.
Solvency: the bankruptcy line
For a reader who never touches a company that could go bankrupt, the debt build warrants a direct check, and it clears comfortably. Zoetis ended 2025 with about $9.2 billion of unsecured debt against $2.31 billion of cash, an undrawn $1.25 billion revolving facility, and an undrawn $1.0 billion commercial paper program [6]. Net debt sits around 1.6 times EBITDA, against a credit-facility covenant ceiling of 3.50 times, and pre-tax interest of $222 million is covered about 16 times by pre-tax profit [4].
Source: FY2025 Annual Report (Form 10-K), long-term debt maturity table [7].
Nothing matures in 2026, and the ladder is spread out to 2050, with the largest single maturity being the $2.0 billion convertible in 2029 [7]. The coupons are mostly low and fixed. Against a business that converts profit to cash at a high rate, this is an investment-grade balance sheet used more aggressively than before, not a stressed one. The bankruptcy exclusion is not triggered; the more apt concern is that leverage has been spent on buybacks rather than kept as dry powder.
Who owns Zoetis
On the reader's insider-ownership question, the answer is unambiguous and modest. As of March 2026, all current directors and executive officers as a group — 22 people — held 912,848 shares, which the proxy confirms is under 1% of the 420.6 million shares outstanding [8]. Chief Executive Kristin Peck's beneficial holding of 492,586 shares is mostly exercisable options; her directly held common stock is about 106,000 shares — a fraction of a single year of her compensation [8]. There is no founder and no family block. The largest holders are index managers: Vanguard at 11.4% and BlackRock at 8.7% [9].
That thin insider stake is the honest weakness for an investor who prizes owner-operators. It is partly offset by what insiders did with their own money as the stock fell. In May 2026, with the shares in the mid-$70s, three directors bought in the open market.
Source: SEC Form 4 filings, open-market purchases dated May 11–13, 2026.
The three purchases totalled about $886,000 — small against a $32 billion company, but they are open-market buys with personal cash near the lows, not grants, and they came from the non-executive chairman and two long-tenured directors, including Frank D'Amelio, Pfizer's former chief financial officer. Insider selling in the period was routine option-exercise and tax-withholding activity, not discretionary exits. The signal is limited by size, but it points the right way.
Governance and the founder-CEO question
Against the reader's standard that weak governance is a reason to walk away, Zoetis screens clean. The board has 12 directors, 11 of them independent; the only non-independent member is the CEO [10]. The roles of chair and chief executive are separated, with Michael McCallister, former Humana CEO, serving as non-executive chairman. Directors stand for election annually, and there is a single class of stock — one share, one vote — so no insider controls the company through structure. CEO pay of $19.0 million in 2025, a 236-to-1 ratio to the median employee, is ordinary for a large-cap pharmaceutical, with about 70% delivered in stock and options that tie it to the share price [11]. None of the usual red flags — dual-class control, a stale board, entrenchment devices, related-party enrichment — are present.
This is where the reader's preference for a founder CEO who personally fronts quarterly calls meets a company that only half-fits it. On the quarterly-call half, Zoetis fits well: Peck leads earnings calls herself, and the company has a deep, consistent record of quarterly disclosure and investor engagement. On the founder half, it does not fit at all. Zoetis was carved out of Pfizer and taken public in 2013; Peck is a professional manager who has run the business since January 2020, not an owner-founder, and the insider group owns under 1%.
Set the founder preference aside, and the case for this structure is stronger than it first looks. A carve-out mega-cap with a genuinely independent board, an independent chair, annual elections, one-share-one-vote, and heavily equity-weighted pay is, on most governance measures, better protected than a founder-controlled company where a single holder can override minority shareholders. Alignment here does not come from a founder's stake; it comes from board independence, compensation tied to the share price, and — as the May 2026 buying shows — directors willing to put personal capital in at the lows. The legitimate residual concern is narrow and specific: with so little insider equity, the buyback and leverage decisions of the past two years rest on the board's judgment and the incentive design, not on a large owner feeling the loss alongside outside holders. That is exactly the kind of decision where a founder's skin in the game would have mattered most — and where, so far, the results argue for keeping management honest with evidence rather than trust.
Growth Runway
The 'breadth carries growth' answer held in FY2025 — livestock +8% and diagnostics +13% lifted group organic growth to +6% while US companion growth flattened — but in Q1 FY2026 the weakness spread into the newer companion franchises meant to be the offset (key dermatology −11%, Librela −13%, OA-pain mAbs −8%), pulling companion animal down 4% and testing whether the diversified portfolio can still carry the group. [1][2][3][4]
FY2025's group +6% organic growth rested on livestock +8% and diagnostics +13% carrying a flat US companion engine. In Q1 FY2026 the newer companion franchises meant to be the offset themselves declined, so companion animal fell 4% [5]; if diagnostics, livestock, and international also roll over, the FY2026 2–5% organic guide becomes the ceiling rather than the floor [6]. The offset is bending, not broken: companion-animal diagnostics still grew 10% and livestock 12% in Q1 FY2026, and neither shares the US pet-visit cycle that is pulling companion animal down [7] [8].
Zoetis's forward growth does not depend on the mature US companion-animal market that stalled in 2025. Animal health globally is still a mid-to-high-single-digit grower, and Zoetis carries a pipeline of 12 products each targeted at $100 million or more of annual sales [9], alongside diagnostics and livestock franchises compounding at double digits. The feared flagship patent cliff is years out. The case is most sensitive to how fast pipeline breadth offsets US category maturity while the largest US categories digest competition.
A growing industry, unevenly
The secular case for animal health is old and durable, and Zoetis has been describing it the same way since its 2013 carve-out: rising pet ownership and spending, companion animals living longer and receiving more medical treatment, and a growing global appetite for animal protein [10]. At the IPO, the companion-animal medicines and vaccines sector was growing at roughly a 6% compound rate [11]. More than a decade later, third-party forecasters still put the whole industry on a mid-to-high-single-digit path.
Sources: third-party market-research forecasts (Grand View Research; Precedence Research; Towards Healthcare; Market.us), compiled July 2026; segment definitions and base years differ across providers, so treat the levels as indicative rather than precise.
Two cautions attach to that table. The forecasts come from commercial research houses, not the filings, and their dispersion is wide — base-year estimates for the total market run from the low-$60-billions to the high-$60-billions depending on scope. And the growth is uneven. The part of the industry that stalled for Zoetis — US companion-animal spending — is the mature part, where clinic traffic has fallen for four straight years (Demand Diagnosis). The industry's growth vectors sit mostly elsewhere: emerging-market companion adoption, diagnostics, and livestock. Reading Zoetis as a slowing business means reading it through its most mature geography; the runway is a question of mix.
Breadth beyond the flagship
Zoetis is more diversified than its US parasiticide-and-dermatology reputation suggests, and 2025 showed the value of that spread. Group revenue grew 6% organically (4 points price, 2 points volume) even as the US companion engine faltered; companion animal grew 5% operationally, livestock 8%, and companion-animal diagnostics 13% [12] [13].
Source: Q4 FY2025 earnings call, prepared remarks [14] [15].
Diagnostics is the quieter of the two offsets and the more interesting. It grew 13% through a year of falling clinic visits [16], because a diagnostic instrument, once placed, pulls recurring consumable and reference-lab revenue that is only loosely tied to visit counts — the opposite of the visit-sensitive parasiticide dynamic in Demand Diagnosis. Third-party forecasters see animal diagnostics compounding at roughly 10% into the mid-2030s, and Zoetis is expanding the platform through in-clinic launches, AI-enabled imaging, and a next-generation chemistry system due in 2026.
Livestock carries its own secular story, distinct from companion demand. Management frames it around global protein consumption rising with income, a US demand tailwind from GLP-1 use and updated nutritional guidance, and an industry-wide shift from treating disease to preventing it [17]. Whether those tailwinds fully arrive is uncertain, but the point for the growth runway is structural: the livestock, diagnostics, and international companion businesses do not share the US pet-visit cycle, so a stalled US flagship does not stall the whole company.
The pipeline
The reacceleration case rests on innovation, and Zoetis funds it consistently. Research and development spending rose from $614 million in 2023 to $698 million in 2025, holding around 7% of revenue through the slowdown [18]. Management's stated output is a pipeline of 12 potential blockbusters — its own bar for that word is $100 million or more of annual revenue — including candidates that open entirely new categories of care [19].
Research Spend, FY2025 ($M)
Research as % of Revenue
Pipeline Blockbusters ($100M+)
Source: FY2025 10-K, MD&A [20]; pipeline count per Q4 FY2025 earnings call [21].
The engine has two gears. The first is lifecycle innovation — extending an existing molecule with new species, claims, combinations, and formulations — which is how the Simparica franchise grew into a $1.5 billion, 12%-growth business through the Simparica Trio triple-combination, and how Apoquel was reformulated into a chewable [22]. The second is new-category creation: the osteoarthritis-pain monoclonal antibodies Librela and Solensia, a long-acting successor in development, and the diagnostics platform. Both gears feed the same historical formula management has repeated on nearly every call — grow faster than the market [23]. At its 2022 investor day, Zoetis pegged its largest category, parasiticides, at $6.3 billion in 2022 growing to $10–12 billion by 2032, and expected to outgrow that pool [24].
That formula met its first real US test in early 2026. Where a category is still expanding — international companion, livestock, diagnostics — the innovation-led share-gain model still works. Where a category stopped expanding, as US parasiticides and dermatology did, branded rivals took share directly out of Zoetis's base rather than out of new market growth (Franchise Moat). The pipeline's job has therefore shifted: less about taking share in growing pools, more about opening new pools fast enough to replace a maturing flagship. Twelve blockbuster candidates is a credible answer on paper; none has yet been proven at scale, and management's own framing has moved from growth "driven by new product cycles" toward a more measured tone.
The patent question, reframed
The word "cliff" hangs over any patent-protected drug company, but for Zoetis's companion flagships the near-term reality is milder than the label implies. The 10-K's patent-expiry disclosures name only older livestock and legacy products — tulathromycin (Draxxin), the ceftiofur line, and Cerenia's formulation patents running to 2025–2028. The filings are silent on the timing for Apoquel and Simparica. Third-party patent trackers fill that gap: the core compound patent for Apoquel's oclacitinib runs to roughly 2030, and Simparica's sarolaner to roughly 2032, with reformulations and combinations (Apoquel Chewable, Simparica Trio) layering further protection on top. Both drugs' original FDA marketing exclusivities have already lapsed, so the flagships are patent-defended but no longer exclusivity-defended.
Sources: legacy expiries per FY2025 10-K, Intellectual Property [25]; companion-flagship compound-patent dates per third-party patent trackers (Greyb/Pharsight), not company disclosure.
The more important point is structural: in animal health, loss of exclusivity is a slow bleed, not a step change. Unlike human pharma, there is no large, well-capitalized generic company competing globally, because each product opportunity is smaller and distribution runs directly through veterinarians who prescribe and dispense on a mostly self-pay basis [26]. Zoetis's portfolio still carries more than 5,500 granted patents and 1,600 pending [27], and the company argues that brand loyalty typically persists after patents lapse [28]. The contrast with human pharma is stark: a large-cap human drugmaker can lose the bulk of a product's sales within a year or two of a biosimilar entering. Animal-health erosion plays out over many years.
That slow bleed is real, not painless. The precedent inside Zoetis's own portfolio is Draxxin, which lost roughly two-thirds of its US sales to generics after patents expired (Franchise Moat), and generic Cerenia has already been approved in the US. And the near-term threat to the companion flagships is not generics at all — it is branded competitors launching directly against Simparica and Apoquel while their patents are still in force. For the growth runway, that reframes the risk usefully: the pressure on Zoetis over the next three to five years is competitive and cyclical, not a wave of expiring exclusivity.
What would change the read
The evidence points to a growth runway that is real at the industry and portfolio level. Animal health remains a sunrise sector globally; Zoetis's diagnostics, livestock, and international companion businesses grew through a year that broke its US flagship; the funded pipeline is broad; and the flagship patents run to the end of the decade and beyond. On the balance of evidence, the industry- and portfolio-level runway is intact; the open question is the pace at which new pipeline converts while the largest, most mature category digests competition.
The strongest fact against that read is that the "grow faster than the market" formula just failed its first genuine US test, 2026 guidance of 2–5% sits below the algorithm's historical output [29], and not one of the 12 blockbuster candidates has yet proven it can carry a franchise the way Simparica Trio did.
What would resolve it, in either direction, is observable. On the constructive side: new-category launches crossing the $100 million threshold, US companion demand stabilizing, and diagnostics and livestock sustaining double-digit growth. On the other: a second guidance cut, flagship share loss accelerating, or the pipeline slipping. Those are the markers that separate a temporary air pocket from a structurally slower compounder — and they will show up in the quarterly numbers long before they show up in the multiple.
Valuation and Margin of Safety
At about $76, Zoetis trades near 11 times forward earnings and a 7% free-cash-flow yield — roughly a third of its historical multiple — which embeds only 2–3% long-run growth against a mid-single-digit runway and consensus earnings growth near 7%. That distance between what the price assumes and what the business and consensus expect is the margin of safety, and this chapter measures it.
The stakes sit in the chapter's own value band. On a 9–10% required return less the 7.1% free-cash-flow yield, the Gordon arithmetic leaves only 2–3% of long-run growth in the price, against consensus adjusted-EPS growth near 7% and a mid-single-digit industry runway (Growth Runway). The band is asymmetric: a re-rating to the mid-teens — a base case of about $96 (14x the $6.86 consensus) — is roughly 27% above the current price, while the bear case of about $60 on a second stumble is about 21% below it.
Part of the de-rating is earned, and the same treatment has to carry that. Growth has genuinely slowed — FY2026 organic revenue is guided to 2–5% — and the pre-2022 low-30s multiple may prove a ceiling rather than a way-point if the US companion business does not re-accelerate. The gap is real but conditional: it is compensation for a demand recovery that has not yet appeared in the numbers.
Where the price sits
Zoetis closed at $75.65 on July 18, 2026, against basic earnings of $6.03 and diluted earnings of $6.02 per share for 2025 [1]. With 422.1 million shares outstanding in February 2026, that is a market value of roughly $31.9 billion [2]. Consensus puts adjusted earnings at $6.86 for 2026 and $7.39 for 2027, so the stock trades at about 11 times the current year and roughly 10 times next year.
Share Price
Forward P/E (x)
FCF Yield
Dividend Yield
Sources: price as reported (July 18, 2026); forward multiple on consensus 2026 adjusted EPS of $6.86; FCF yield on $2.28B free cash flow (Cash Conversion) over $31.9B market value; dividend on $2.030 declared per share [2].
The same $76 buys a 7.1% free-cash-flow yield — $2.28 billion of free cash flow, built on $2,904 million of operating cash flow [3], against a $31.9 billion market value — a trailing earnings yield near 8%, and a 2.7% dividend on the $2.03 paid in 2025 [4]. On enterprise value — $31.9 billion of equity plus $6.6 billion of net debt (Capital Allocation) — the business changes hands at about 9.5 times EBITDA. For a company earning a 28% net margin and a return on equity near 78% (The De-Rating), those are not the multiples the market once assigned it.
A multiple cut to a third of its history
Zoetis spent most of its public life as a premium compounder, and the market paid for it. Measured on year-end price against that year's earnings, the trailing multiple ran in the low-30s and higher for the better part of a decade — and briefly reached the high-50s in the 2020–2021 pandemic pet boom. It now sits at 12.6 times.
Source: derived from reported diluted EPS [5] and year-end closing prices; the 2026 point is the July 18, 2026 price on 2025 EPS.
Two things are worth separating in that line. The multiple began falling in 2022, well before the price capitulated: earnings grew into a still-elevated share price, so the P/E came down even as the stock held above $145. The second, sharper leg — from about 21 times at the end of 2025 to 12.6 times by mid-2026 — followed the first-quarter guidance cut and the demand break (Demand Diagnosis). The de-rating is real, and part of it is deserved: a business now guided to 2–5% organic growth should not trade where a high-single-digit grower did. The honest reference point is not the 40-to-57-times bubble years, which were a low-rate, pandemic-demand artifact unlikely to return, but the low-30s the stock held in more normal periods. Against that anchor, the multiple has still roughly halved.
The cheapest of the quality names
Animal health has few clean public comparables. Merck Animal Health and Boehringer Ingelheim's animal unit sit inside far larger parents, so their market multiples say nothing about the segment. Of the listed pure-plays, Elanco — the closest direct competitor — is a leveraged turnaround that lost money in 2025, so it has no meaningful earnings multiple. IDEXX, the diagnostics leader Zoetis names as a principal competitor, is the one high-quality peer that trades cleanly, and it trades at about 43 times trailing earnings.
Source: derived from each company's FY2025 filings and market prices, as reported; Elanco's P/E is not meaningful on a 2025 net loss.
The comparison flatters Zoetis, and it should be read with care rather than as a verdict. IDEXX grows faster and runs a razor-and-blade diagnostics model with recurring consumable revenue, which earns some of its premium; a multiple gap to it is warranted, just not a gap this wide on a business with a higher net margin. Elanco's absence of earnings is the more instructive point: it shows that scale, patent-protected brands and a 28% margin are not the industry default but Zoetis's own achievement. Among companies that actually convert animal-health revenue into profit at scale, Zoetis is now the least expensively priced.
What $76 implies
A margin of safety is a gap between price and value, so the useful question is what growth the price already assumes. A 7.1% free-cash-flow yield is, in steady state, a return of the yield plus the growth of that cash. For an owner demanding a 9–10% total return, the arithmetic leaves 2–3% of long-run cash-flow growth embedded in the current price. Consensus, by contrast, has adjusted earnings growing about 7% in each of the next two years, and the industry itself is forecast to compound in the mid-to-high single digits (Growth Runway).
That distance — roughly 2–3% priced versus a mid-single-digit runway — is the margin of safety. Translating it into a value range makes both the reward and the fragility explicit.
Source: multiples applied by the author to consensus adjusted EPS; consensus estimates and the $114.76 mean / $112 median price target from analyst data, as reported; current price as reported.
The band is asymmetric in the buyer's favour: a re-rating merely to the mid-teens — well short of the historical low-30s — on earnings the consensus already expects to grow puts the shares 25–50% higher, while the bear case, a return to a decade low on a second stumble, implies roughly a fifth of downside. The sell-side mean target of about $115 sits inside that base-to-bull span, though a value buyer should treat consensus targets as a cross-check, not a foundation — the same analysts held far higher targets on the way down, and the range today runs from $80 to $160.
The quality of the earnings behind the multiple
Two facts keep this from being a clean margin-of-safety case, and both belong in the buyer's view.
First, the earnings growth the multiple is being measured against is not all organic. Consensus sees adjusted EPS rising about 7% a year while revenue grows only 3–4%; the wedge is share count and margin. Zoetis has retired roughly 9% of its shares since 2022 and expanded margins, and those levers flatter per-share earnings in a way that a 2–5% top line does not (Capital Allocation). A value assessment that leans on forward EPS is partly leaning on the buyback continuing.
Second, the 7.1% free-cash-flow yield overstates what reaches owners. In 2025 Zoetis returned $4.12 billion — about 1.8 times free cash flow — and funded the gap with new debt, lifting net debt to roughly $6.6 billion, near 1.6 times EBITDA (Capital Allocation). The company still bought back 16.6 million shares in the fourth quarter of 2025 at an average of $124.31, well above today's price, with $2.4 billion left on a $6 billion authorization [2]. The cash is real and the balance sheet is sound, but the yield is not fully distributable while the company is also servicing and adding leverage.
This is a fallen-star profile: a −69% drawdown in a sunrise sector, priced for almost no growth, with conditions guided to stay soft for the next several quarters before improving. The one classic ingredient it lacks is a large insider stake — directors and officers own under 1% (Capital Allocation).
The read
On the evidence, a margin of safety exists at $76: the price embeds 2–3% long-run growth against a mid-single-digit runway, the multiple has halved from its normal range, the free-cash-flow and earnings yields are near 7–8%, and the shares are the cheapest of the profitable animal-health names. The strongest fact against that read is that some of the discount is earned — growth has genuinely slowed, the forward earnings rest partly on buybacks and margin rather than volume, and the pre-2022 low-30s multiple may prove a ceiling rather than a way-point if the US companion business does not re-accelerate.
What would settle it is observable and near-term. Positive US companion organic growth in the next two or three quarters, no second guidance cut, and evidence that the pipeline is crossing into revenue would confirm the trough and support a re-rating toward the base case. A second cut, or continued share loss in the flagships, would validate the market's discount and pull value toward the bear line. The margin of safety here is meaningful but conditional — it is compensation for a demand recovery that has not yet appeared in the numbers, not a discount independent of it.
Scenarios and Watch Items
The preceding chapters established the pieces: a wide-moat franchise, a demand stall that is part cyclical and part structural, cash that converts, capital returned faster than it was earned, a growth runway that lives outside the stalled US flagship, and a price that has de-rated to roughly a third of its historical multiple. This chapter puts them in one frame — a bull/bear reconciliation, three value scenarios, and the dated, checkable signals that would move the read from one to another. It reaches no verdict; the signals that would settle the read have not yet printed.
Where the reads diverge
Every building block in this report is genuinely two-sided. The table below is not a scorecard — it pairs each shared fact with the strongest bull and bear reading and, in the last column, the specific evidence that would settle it. The pattern is consistent: the optimistic and pessimistic cases draw on the same numbers and differ on what the next few quarters reveal.
Sources: Q1 FY2026 earnings call [1]; [2]; FY2025 10-K [3]; [4].
Two rows carry the most weight because they feed each other. Demand determines whether the growth runway (Growth Runway) has to be carried by the pipeline or merely supplemented by it; valuation (Margin of Safety) sets how much of that outcome is already in the price — at ~$76 the stock embeds only ~2–3% long-run growth. The rest — moat, cash, capital allocation — bound the downside rather than drive the upside.
Three scenarios
The value band below reconciles the six blocks into three coherent outcomes, each measured against the roughly $76 the stock traded at in mid-July 2026. The scenarios are not equally weighted forecasts; they are internally consistent worlds, each requiring a specific chain of the facts above to resolve one way.
Source: derived from FY2025 reported EPS and FY2026–27 consensus, applying scenario multiples [5]; [6].
Bear (~$60, about 21% below the price). US companion demand does not trough in 2026; a second guidance cut follows the first, and the multiple holds near 10x depressed earnings. This is the world where the demand stall is structural, the pricing lever keeps narrowing, and the pipeline arrives too late to backfill the flagships. The debt-funded 2025 buyback [7] looks like value destroyed rather than shares retired cheaply.
Base (~$96, about 27% above). The group holds mid-single-digit organic growth as breadth offsets the mature US flagship — diagnostics grew 13% and livestock 8% in 2025 [8] — the US troughs but does not collapse, and the multiple normalizes toward 14x. Consensus sits here: the sell-side mean target is roughly $115, above even the base value line, which is a cross-check on the direction rather than a foundation.
Bull (~$133, about 76% above). US companion re-accelerates, new-category launches cross the $100M blockbuster threshold on schedule, and the multiple re-rates toward 18x on 2027 earnings. This requires both the demand row and the growth row to resolve favorably at once — the least likely single outcome, and the one most dependent on evidence that does not yet exist.
The asymmetry is the point a value reader cares about: the downside to ~$60 is roughly 21%, the base upside roughly 27%, and the band is most sensitive to whether US companion demand troughs in Q2/Q3 2026. That is a real but conditional margin of safety, not an unconditional one.
The swing factor between base and bull
What separates a stock that troughs and recovers from one that compounds is whether the pipeline is real and on time — and here the evidence is genuinely mixed. Management points to 12 potential blockbusters and a cost-and-productivity program to protect margins while the top line resets [9]. Against that, the newest new-category franchise carries a safety overhang: in December 2024 the FDA issued a Dear Veterinarian Letter on adverse events, including deaths, reported in dogs treated with the osteoarthritis antibody Librela, and Zoetis updated the US label in February 2025 [10].
The numbers show the pressure without settling it. In Q1 2026, Librela and its feline counterpart Solensia posted a combined $140M, down 8%, with Librela itself at $101M, down 13% — though management said US Librela trends had stabilized [11]. The same quarter, key dermatology fell 11% as Apoquel met competition, and Simparica Trio slipped 1% [12]. A pipeline that must both replace a decaying flagship base and open new categories, while its flagship new category works through a safety label, is the difference between the base and bull value lines — and it is not resolvable from the filings alone.
What to watch
The signals below are ranked by decision value: each names a line item, the filing or event where it appears, and the threshold that would move the read. The next print — Q2 FY2026, due in early August 2026 — carries the most information, because it is the first clean read on whether the US stall is troughing after the fiscal-year-alignment noise that flattered Q1 (excluding a ~$100M timing shift, the group would have declined 5% organically) [13].
Sources: Q1 FY2026 earnings call [14]; [15]; FY2025 10-K capital-structure disclosures [16].
Each of these is falsifiable within two prints. That matters for a near-term-pain, later-gain entry: the thesis is designed to be wrong quickly if it is wrong, rather than to require years of faith.
How the case maps to a margin-of-safety frame
For an investor who buys fallen stars in sunrise sectors and always demands a margin of safety, Zoetis fits the profile and clears the disqualifiers, with one classic ingredient missing. The setup is a genuine fallen star — down about 69% from its 2021 peak — in a sector with a mid-to-high-single-digit secular runway, priced near the bottom of a "bad for six-to-twelve months, then improving" window that the demand row will confirm or deny.
The two hard exclusions are cleared. Bankruptcy is not a live risk: net debt runs about 1.6x EBITDA against a 3.50x covenant, interest is covered roughly 16x, and maturities are laddered out to 2050 with nothing due in 2026 [17]. Governance screens clean: the board is 11-of-12 independent with an independent chair, single-class shares, and annual elections [18].
The missing ingredient is insider ownership. Directors and officers as a group hold under 1% of the company and there is no founder, so alignment rests on compensation design and board judgment rather than a large owner's capital at risk [19]. The partial offset is recent and directional: three directors bought about $886,000 of stock in the open market near the mid-2026 lows [20]. It is a small signal against a ~$32B market value, but it points the same way as the base case rather than against it.
The reconciliation, then, is not a verdict but a shape: a high-return, cash-generative franchise trading for a low-growth multiple, where the downside is bounded by quality and solvency and the upside is most sensitive to whether US companion demand troughs, which the next two quarters will test. What to do with that shape is the reader's call; what to watch is on the table.